Getting Started
Reference Material
Download the slide deck from the workshop introduction session: Tethys Platform Introduction Presentation (PDF).
Scaffold a New App
To begin developing a new Tethys app, you should start with a Tethys scaffold. This will include all the initial files you'll need to get an app up and running.
Change into the tethys-workshop directory you created in the Introduction and activate your virtual environment:
Linux / macOS:
cd tethys-workshop  # if you are not already there
source ./tethys/bin/activate
Windows:
cd tethys-workshop  # if you are not already there
.\tethys\Scripts\activate
Your prompt should now start with (tethys). Scaffold the app by running:
tethys scaffold earthquake_calculator
You will be prompted to enter metadata about the app such as, proper name, version, author, and description. All of these metadata are optional and can be changed later in the generated app.py file (as you'll note later on). You can accept the default values by pressing enter, repeatedly.
In a file browser, open your tethys-workshop directory. If the scaffolding worked, you should see a directory called tethysapp-earthquake_calculator alongside your tethys/ virtual environment folder. All of the source code for your app is located in this new directory.
tethysapp-earthquake_calculator/
├── install.yml
├── pyproject.toml
└── tethysapp/
    └── earthquake_calculator/
        ├── __init__.py
        ├── app.py
        ├── controllers.py
        ├── public/
        │   ├── css/
        │   ├── images/
        │   └── js/
        ├── resources/
        ├── templates/
        │   └── earthquake_calculator/
        │       ├── base.html
        │       └── home.html
        └── tests/
Here's what each file or directory contains:
- install.yml: Configuration file for installing the app dependencies and settings
- pyproject.toml: Project metadata and dependencies configuration
- tethysapp/: Main package directory containing all app source code
- app.py: Core app class and configuration (name, icon, color, etc.)
- controllers.py: View functions and request handlers
- public/: Static files including stylesheets, images, and JavaScript
- resources/: App resources
- templates/: HTML templates for page contents
- tests/: Unit tests for your app
To learn more about scaffolding Tethys apps, see Tethys App Project
Install App
To test your newly scaffolded app, install it by running the following commands:
cd tethysapp-earthquake_calculator
tethys install -d
Go ahead and start your tethys development server with:
tethys start
Now, go to localhost:8000 to view your app in your browser.
If prompted to login, use the default username and password:
username: admin password: pass
Customize Your App
Now that you have your app running, let's customize it.
Some ways you can change the look of your app are:
- App title (shows up in top left corner)
- Icon
- Color
To change these properties of your app, open the app.py file in your app files.
You'll find something that looks like this:
class App(TethysAppBase):
    """
    Tethys app class for Earthquake Calculator
    """

    name = 'Earthquake Calculator'
    package = 'earthquake_calculator'  # WARNING: Do not change this value
    index = 'home'
    icon = f'{package}/images/icon.gif'
    root_url = 'earthquake-calculator'
    color = '#003087'
App Title
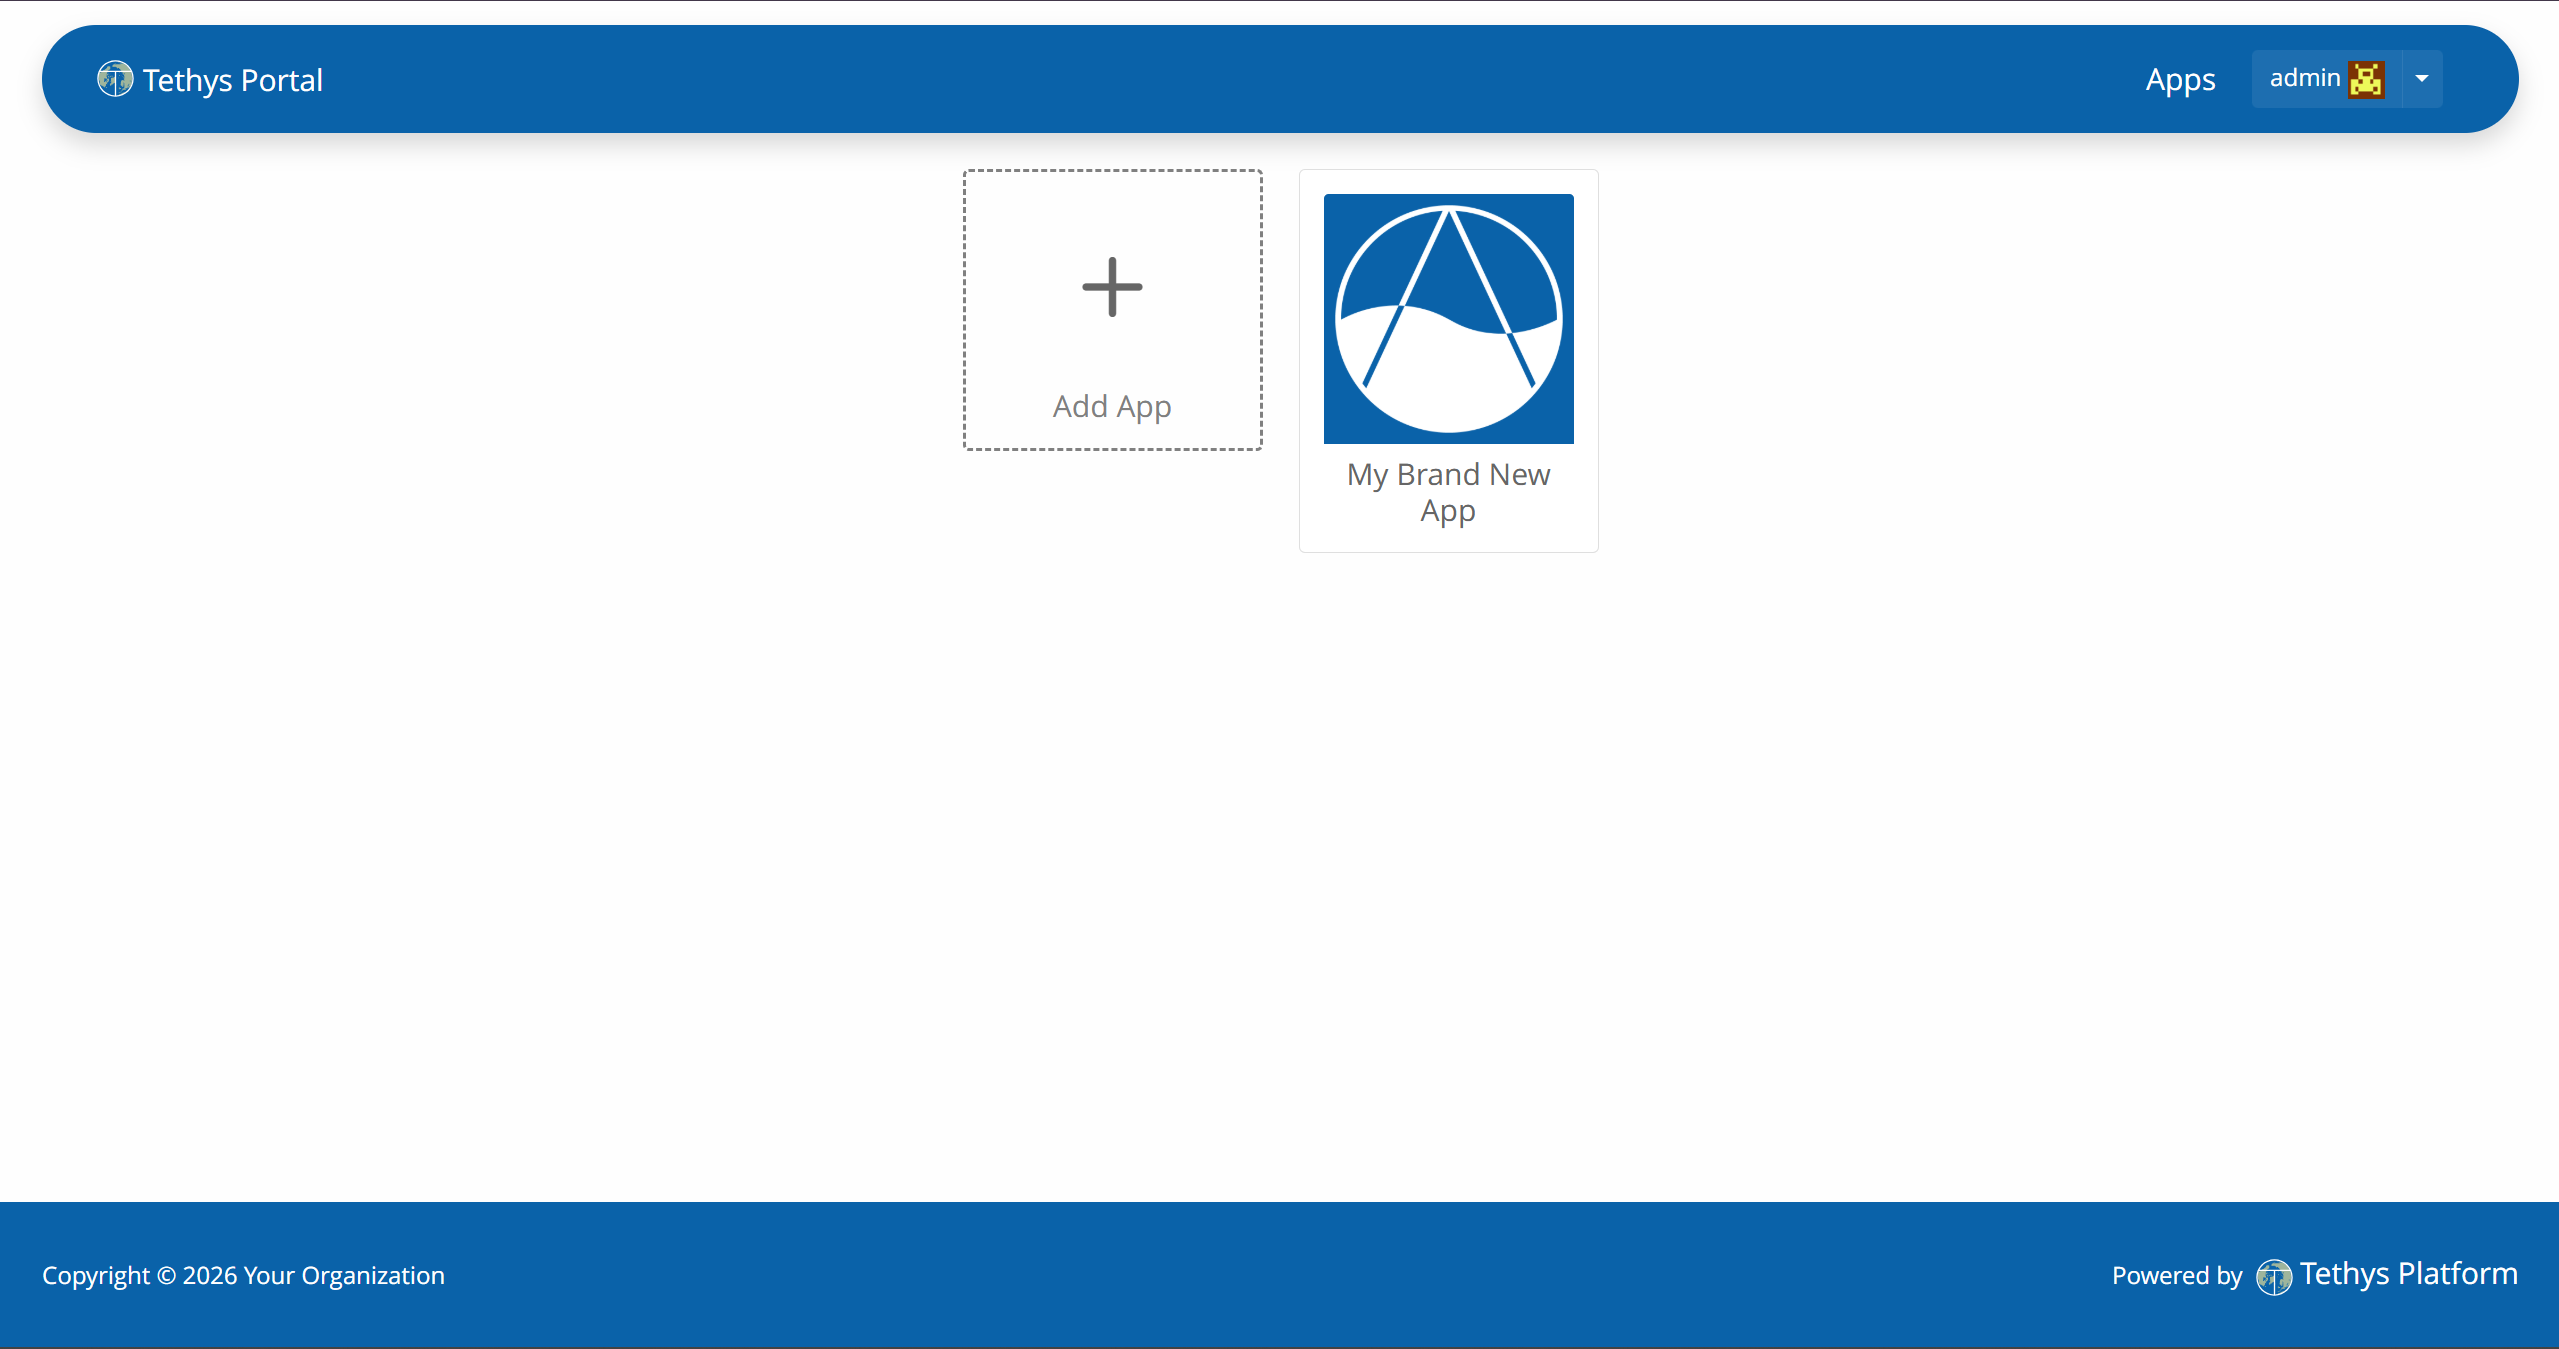
If you'd like to change the name that appears in the Tethys portal for your app, change the 'name' line to whatever you'd like. For example, if you changed it to 'My Brand New App', like so:
name = 'My Brand New App'
You'll then see this in the app library:
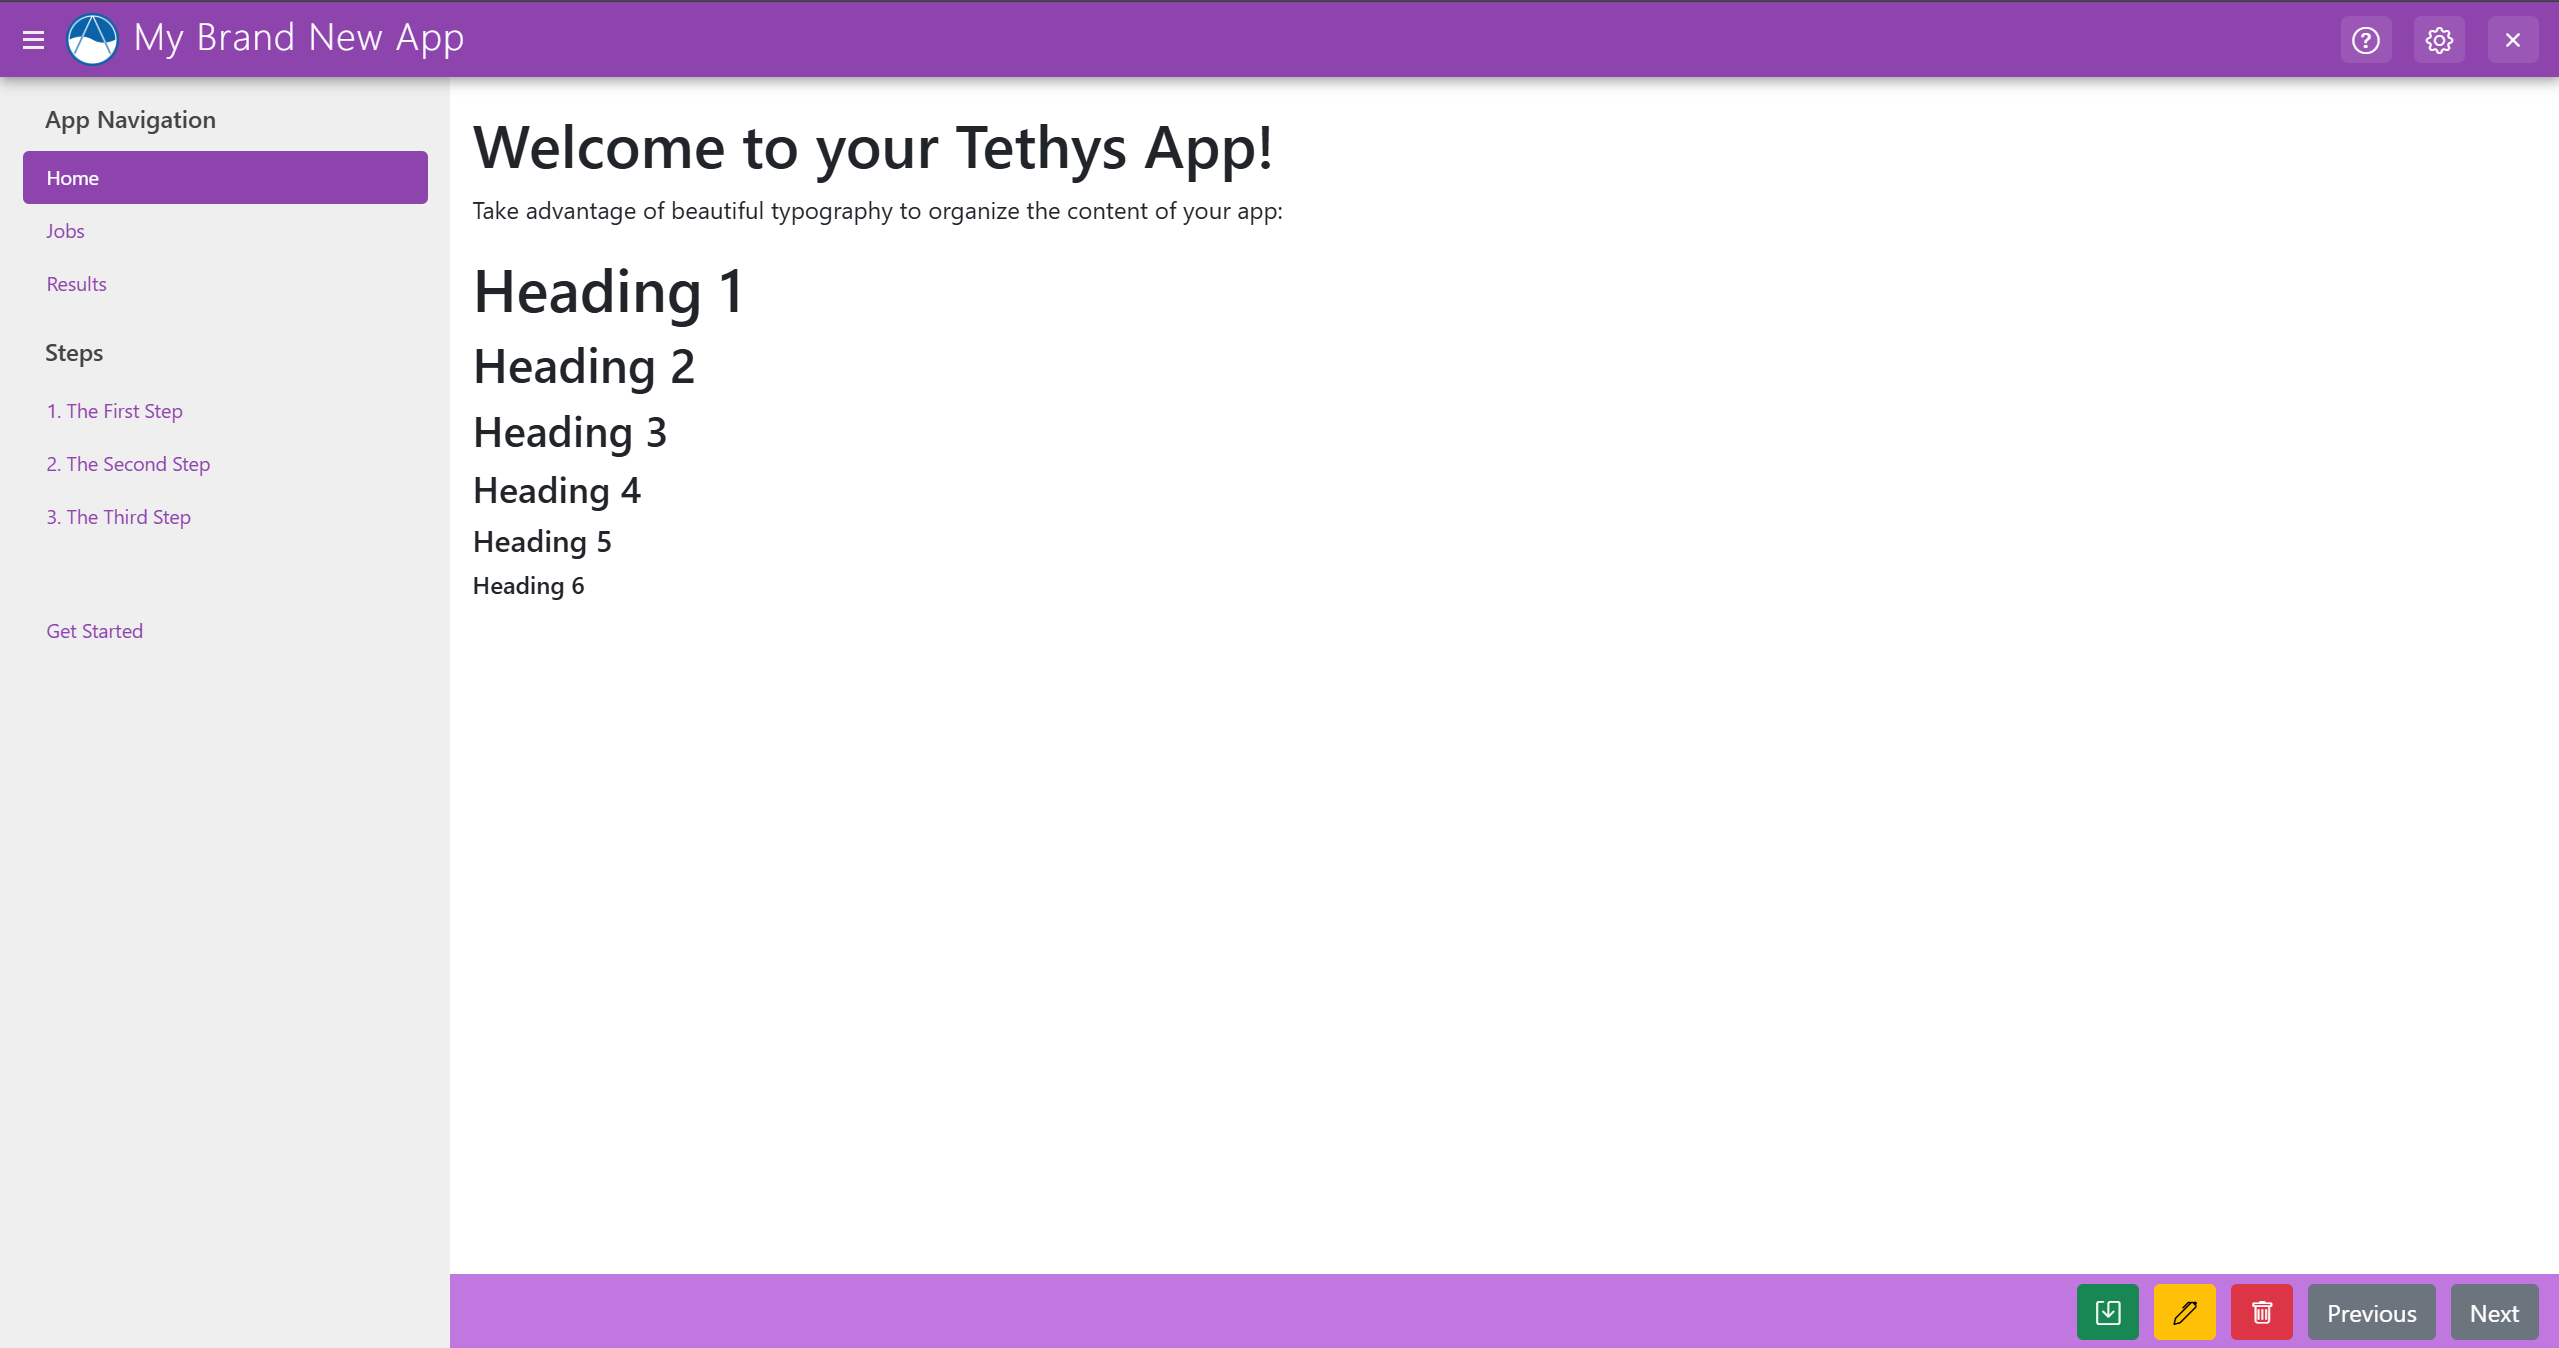
And if you go into your app, you would see something like this:
App Icon
To set the image that shows up for your app in the Tethys library and next to the app name, first add that image to the public/images directory inside your app files.
Here is an example image to use: Download Example App Icon Save the image as earthquake-app-icon.png in the public/images directory of the app.
Then, change the icon attribute to the file name like so:
icon = f'{package}/images/earthquake-app-icon.png'
Check out the app library to see your new app icon. It will also appear in the top left corner inside your app.
App Color
To change the accent color used throughout your app, change the color to any hexcode color you'd like:
color = '#0E4F57'
After making these changes, the development server should reload and then you can reload the page to the changes reflected in the browser.
Add Custom Settings
Soon we'll be adding calculations that your app will run. For those calculations, we'll be using some constants: 'primary velocity' and 'secondary velocity'.
You'll now add two custom settings to your app. This will be saved for all users. You'll be able to set these values in the UI inside your Tethys Portal.
To add these settings add the following code to your app.py file:
from tethys_sdk.app_settings import CustomSetting

class App(TethysAppBase):
    ...

    def custom_settings(self):
        custom_settings = (
            CustomSetting(
                name='primary_velocity',
                type=CustomSetting.TYPE_FLOAT,
                description='Average Primary velocity (km/s)',
                required=True,
            ),
            CustomSetting(
                name='secondary_velocity',
                type=CustomSetting.TYPE_FLOAT,
                description='Average Secondary velocity (km/s)',
                required=True,
            ),
        )

        return custom_settings
Now you can set these values in your app settings by following these steps:
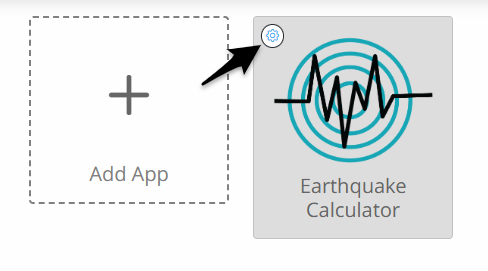
Begin by clicking the settings icon in the top right corner of your app:

You can also access your app's settings from the app library page by hovering over your app icon and clicking the settings icon in the top left corner.
Then scroll down to the CUSTOM SETTINGS section and set your primary_velocity and secondary_velocity values:

Finally, scroll down to the bottom of the page and press the Save button.
We'll go over how to utilize these values later on in the tutorial.
To learn more about Custom Settings, see Custom Settings
Customize Your Home Page
Now, let's try changing the contents of your home page by editing the contents of templates/home.html.
For this tutorial, you'll be building a simple app that performs calculations relating to earthquake data. We'll have the homepage of your app be a page with some introductory information.
Remove everything inside home.html and paste in the following contents:
{% extends tethys_app.package|add:"/base.html" %}
{% load tethys %}

{% block app_content %}
  <div class="container">
    <h1>Earthquake App</h1>
    <p>This is the home page of the Earthquake App.</p>

    <p>In this app, you can perform a powerful analysis of an earthquake's data. </p>
    <a href="calculate"><button class="btn btn-secondary">Go to Calculations Page</button></a>
  </div>

{% endblock %}
Now reload the app in your browser and you should see your introductory information and a button below.
Add a New Page
Next, we'll make it so that when a user presses that "Go to Calculations Page" button, they'll be directed to a new page.
Begin by adding a new template file inside templates/earthquake_calculator called calculations.html.
Paste the following into this file:
{% extends tethys_app.package|add:"/base.html" %}
{% load tethys %}

{% block app_content %}
<p>This is the calculations page</p>
{% endblock %}
Next, we'll need to add a new controller function to render this new page. Inside controllers.py add the following code:
@controller(name="calculate", url='calculate')
def calculate(request):
    return App.render(request, 'calculations.html')
Next, open your app and click on the button that says "Go to Calculations Page".
You should be taken to a new page and now see "This is the calculations page" in the content area of your app.
Add Calculation Inputs
Now, let's look at putting some gizmos into the Calculations Page
Gizmos are building blocks that can be used to create beautiful interactive controls for web apps. Using the Template Gizmos API, developers can add date-pickers, plots, and maps to their app pages with minimal coding.
Define Gizmos in Controller
We begin by adding these gizmos to our controller. The TextInput gizmo creates a text input form field and the Button gizmo creates a styled button.
from tethys_sdk.gizmos import Button, TextInput

@controller(name="calculate", url='calculate')
def calculate(request):
    primary_time_difference1 = TextInput(name='primary_time_difference1', display_text='First Primary Time Difference (seconds)', placeholder='e.g. 10', attributes={'type': 'number'})
    secondary_time_difference1 = TextInput(name='secondary_time_difference1', display_text='First Secondary Time Difference (seconds)', placeholder='e.g. 20', attributes={'type': 'number'})
    primary_time_difference2 = TextInput(name='primary_time_difference2', display_text='Second Primary Time Difference (seconds)', placeholder='e.g. 10', attributes={'type': 'number'})
    secondary_time_difference2 = TextInput(name='secondary_time_difference2', display_text='Second Secondary Time Difference (seconds)', placeholder='e.g. 20', attributes={'type': 'number'})
    calculate_button = Button(display_text='Calculate', name='calculate_button', icon='fa fa-calculator', submit=True, attributes={'class': 'btn btn-primary'})

    context = {
        'primary_time_difference1': primary_time_difference1,
        'secondary_time_difference1': secondary_time_difference1,
        'primary_time_difference2': primary_time_difference2,
        'secondary_time_difference2': secondary_time_difference2,
        'calculate_button': calculate_button
    }

    return App.render(request, 'calculations.html', context)
Add Gizmos to Template
Now that you've defined these gizmos, you'll need to add them to your page inside the template. Open calculations.html and add the following:
{% block app_content %}
  {% gizmo primary_time_difference1 %}
  {% gizmo secondary_time_difference1 %}
  {% gizmo primary_time_difference2 %}
  {% gizmo secondary_time_difference2 %}
  {% gizmo calculate_button %}
{% endblock %}
After refreshing the page in your browser, you should see the form with 4 inputs and a "Calculate" button just like this:
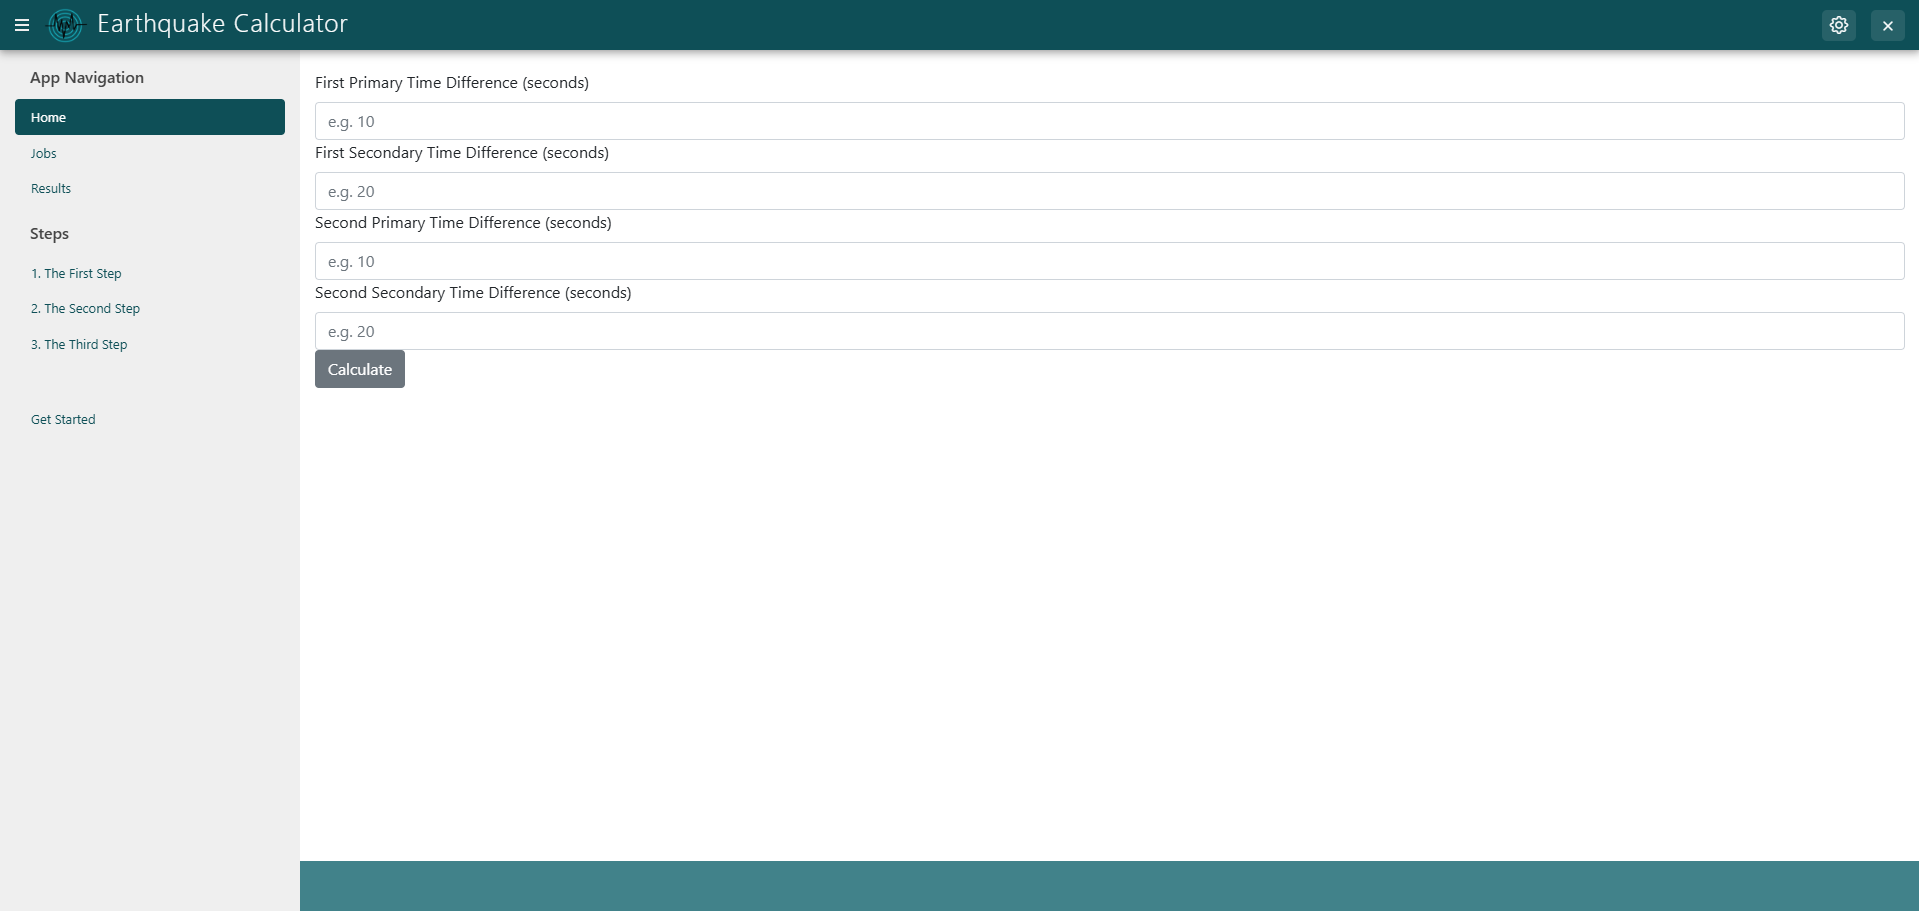
For now, the calculate button won't actually calculate anything. We'll change that soon.
To learn more about Tethys Gizmos see the following links:
Update Base Template
We are currently using the default version of what is called a base template. That template provides all of these highlighted portions of the page:
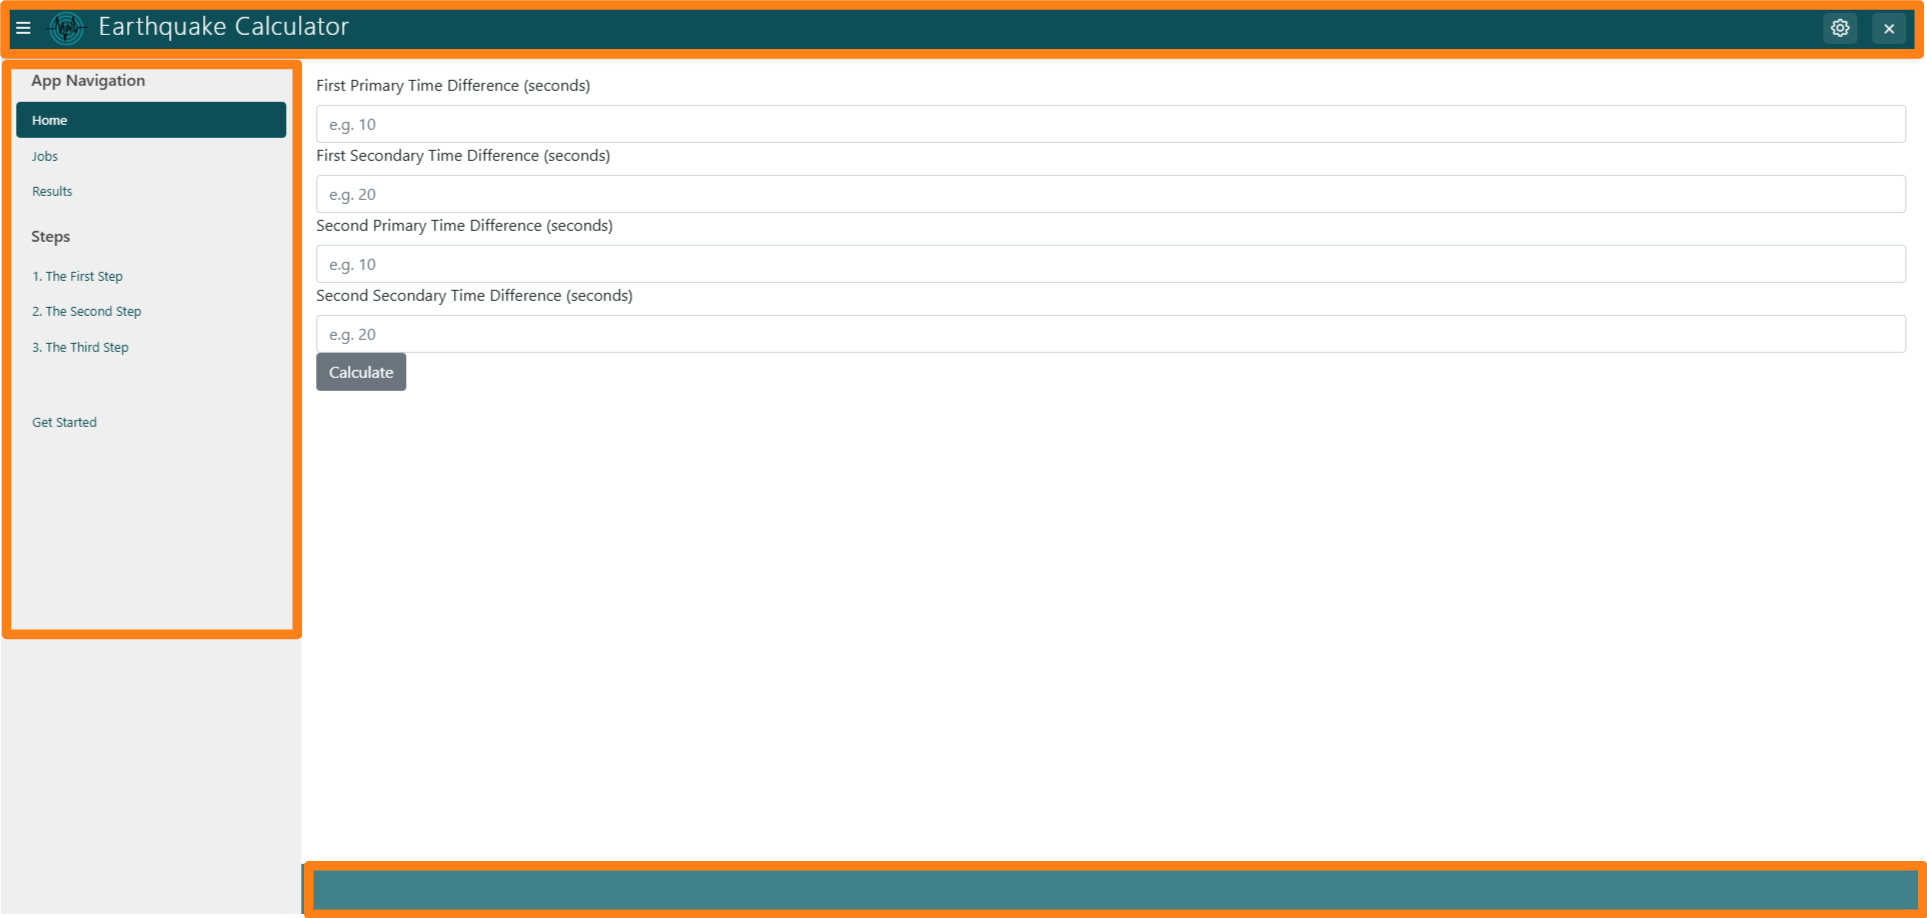
We can change that template, however. For our calculation page, we're going to use a base template that provides two columns with no navigation bar on the side.
Change the top line of your calculations.html file to this:
{% extends "tethys_apps/app_two_columns.html" %}
Next, let's place the calculation inputs in the left column of your page.
Update the name of the app_content block to:
{% block app_content_lc %}
  {% gizmo primary_time_difference1 %}
  {% gizmo secondary_time_difference1 %}
  {% gizmo primary_time_difference2 %}
  {% gizmo secondary_time_difference2 %}
  {% gizmo calculate_button %}
{% endblock %}
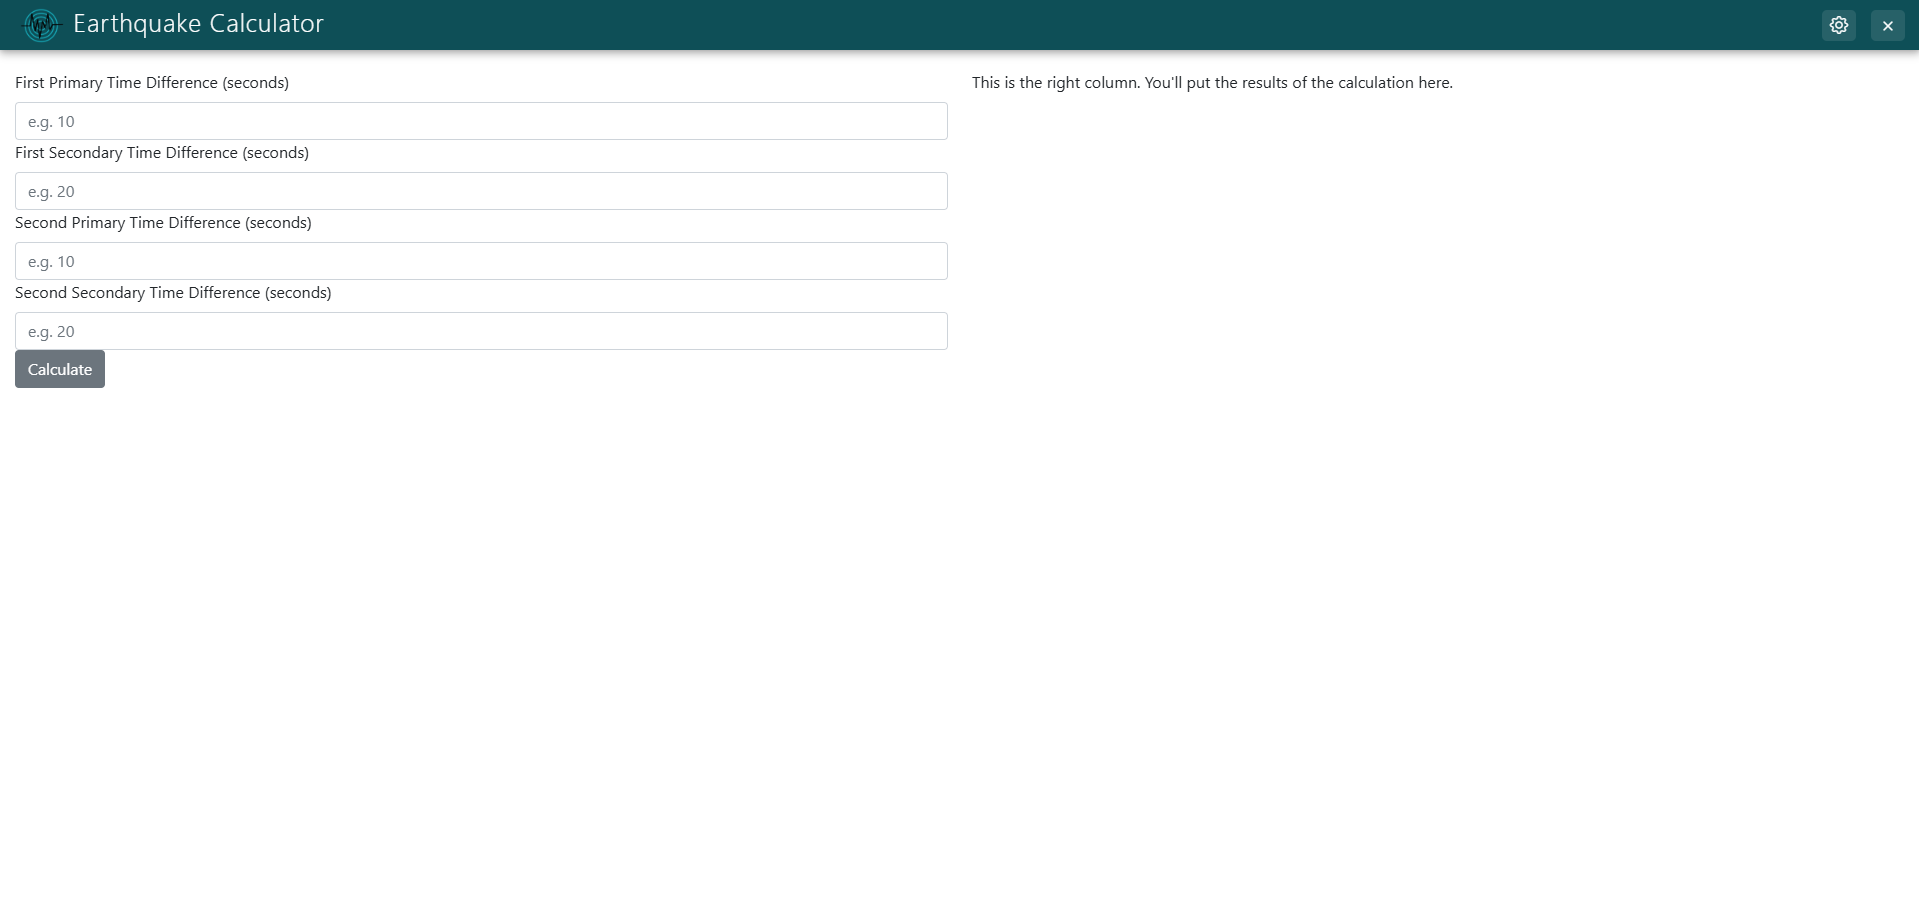
While we're at it, let's add a bit of content to the right column so you can visualize how these columns will look.
Add the following to calculations.html:
{% block app_content_rc %}
  <p>This is the right column. You'll put the results of the calculation here.</p>
{% endblock %}
Go ahead and refresh your page in the browser, and you'll see this:
To learn more about templates, along with a full list of base templates that are available with Tethys Platform, check out App Templating
Add Form Submission
Now, let's get your calculate button working.
For that we'll need to place your inputs into a <form>. This will allow the page to send the input data together to your view to run the calculation and return data.
Add a Form
Now we'll need to add a form to the calculations page to handle submitting the inputs for calculations.
Begin by putting the gizmo elements inside a new <form> element and add a {% csrf_token %} element in the calculations.html as shown below:
{% block app_content_lc %}
    <form method="post" id="calculation-form">
        {% csrf_token %}
        {% gizmo primary_time_difference1 %}
        {% gizmo secondary_time_difference1 %}
        {% gizmo primary_time_difference2 %}
        {% gizmo secondary_time_difference2 %}
        {% gizmo calculate_button %}
    </form>
{% endblock %}
Next, we'll add a new file called utils.py in the same folder as controllers.py with the following contents:
def calculate_distance(ts, tp, vs, vp):
    distance = (ts - tp) / ((1/vs) - (1/vp))
    return distance
Update Controller
Now, let's update the controller to handle a POST request that will come from this form. Along with the POST data, we'll use the custom setting values you configured earlier using App.get_custom_setting():
from .utils import calculate_distance
...

@controller(name="calculate", url='calculate')
def calculate(request):
    ...

    if request.method == "POST":
        primary_velocity = App.get_custom_setting('primary_velocity')
        secondary_velocity = App.get_custom_setting('secondary_velocity')

        primary_time_difference1_value = float(request.POST.get('primary_time_difference1'))
        secondary_time_difference1_value = float(request.POST.get('secondary_time_difference1'))
        primary_time_difference2_value = float(request.POST.get('primary_time_difference2'))
        secondary_time_difference2_value = float(request.POST.get('secondary_time_difference2'))

        distance1 = calculate_distance(
            primary_time_difference1_value,
            secondary_time_difference1_value,
            primary_velocity,
            secondary_velocity
        )

        distance2 = calculate_distance(
            primary_time_difference2_value,
            secondary_time_difference2_value,
            primary_velocity,
            secondary_velocity
        )

        print("Distance 1: ", distance1)
        print("Distance 2: ", distance2)

    return App.render(request, 'calculations.html', context)
Now go ahead and add time difference values to the four inputs in your calculation page, and press the calculate button.
You should see values showing up in your terminal. Those values represent the distances from the epicenter of the earthquake you are analyzing given the time difference values you provided.
Display results in page
Now, let's update your calculation results side to show the results in your calculation page:
Begin by adding the distances to your context that will be passed into your template from your calculation controller:
@controller(name="calculate", url='calculate')
def calculate(request):
    ...
    if request.method == "POST":
        ...

        context["distance1"] = distance1
        context["distance2"] = distance2

    return App.render(request, 'calculations.html', context)
Now, let's render those results in the template. This template will render regardless if the post request has been sent, so we'll want to only show the results after we've checked if the context includes them.
{% block app_content_rc %}
  {% if distance1 and distance2 %}
      <p>Distance 1: {{ distance1 }}</p>
      <p>Distance 2: {{ distance2 }}</p>
  {% else %}
      <p>Run the calculation to the left to see data here.</p>
  {% endif %}
{% endblock %}
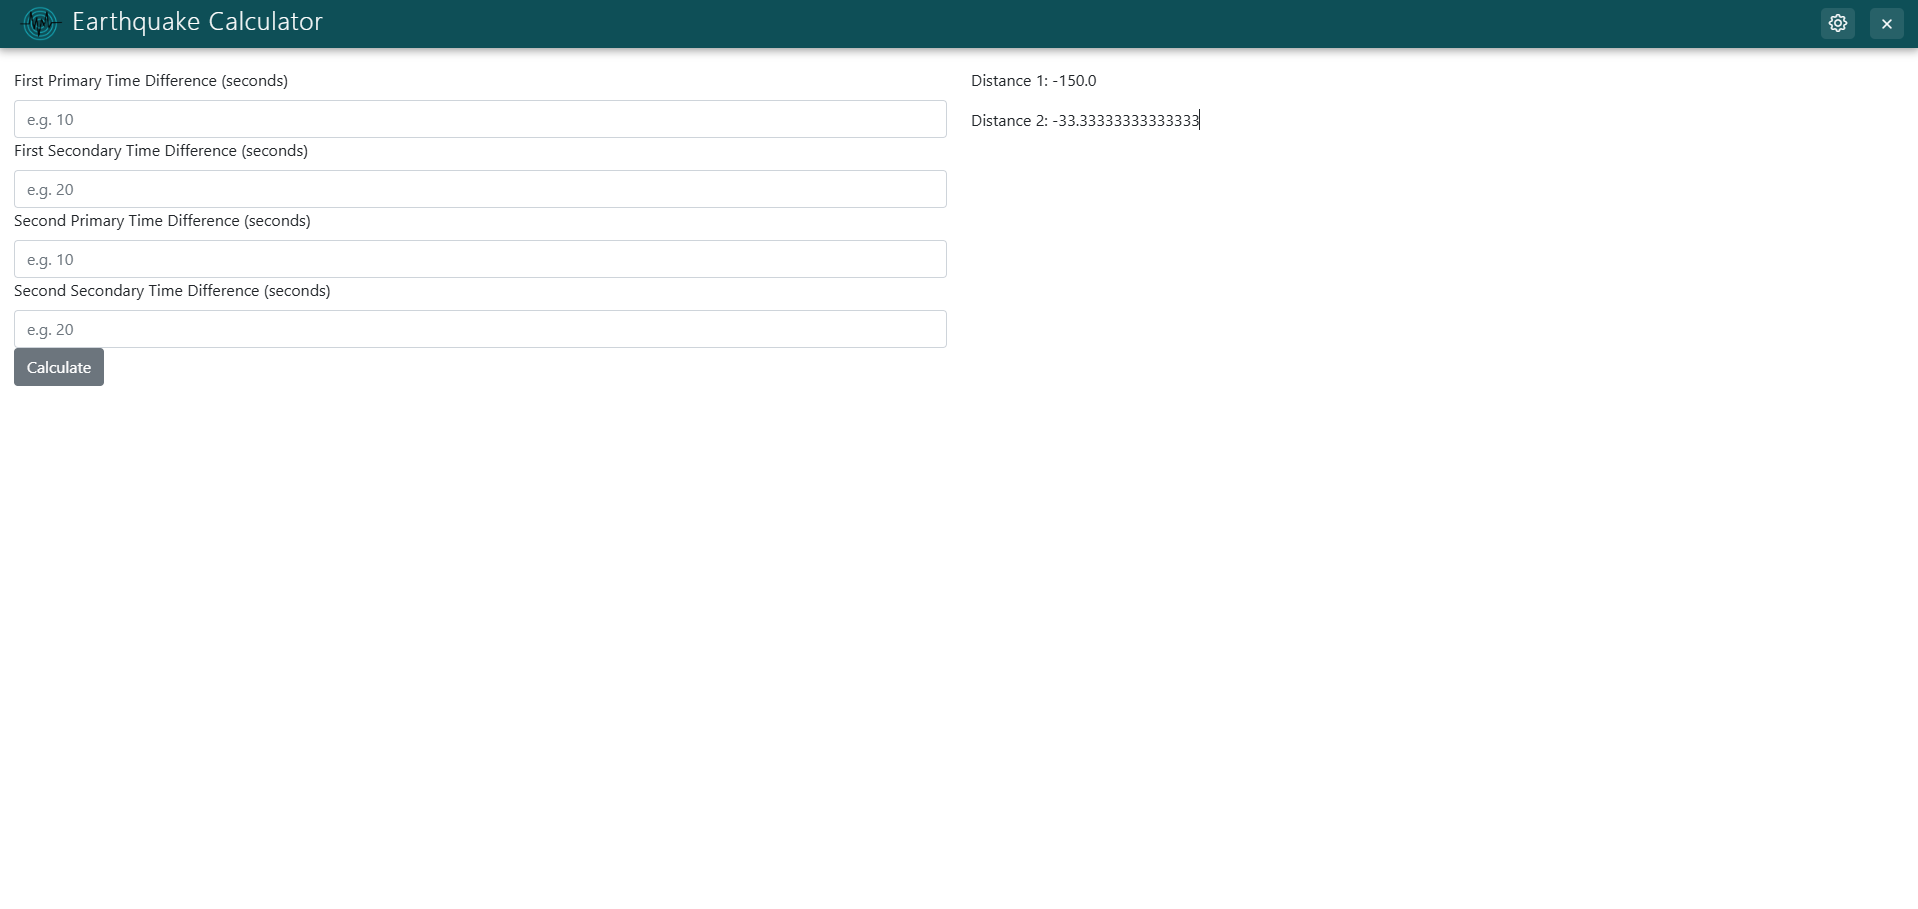
Now go ahead and refresh the page, and test the calculations again. You should see your results show up in the right column of your page like so:
Add Plot Graphic
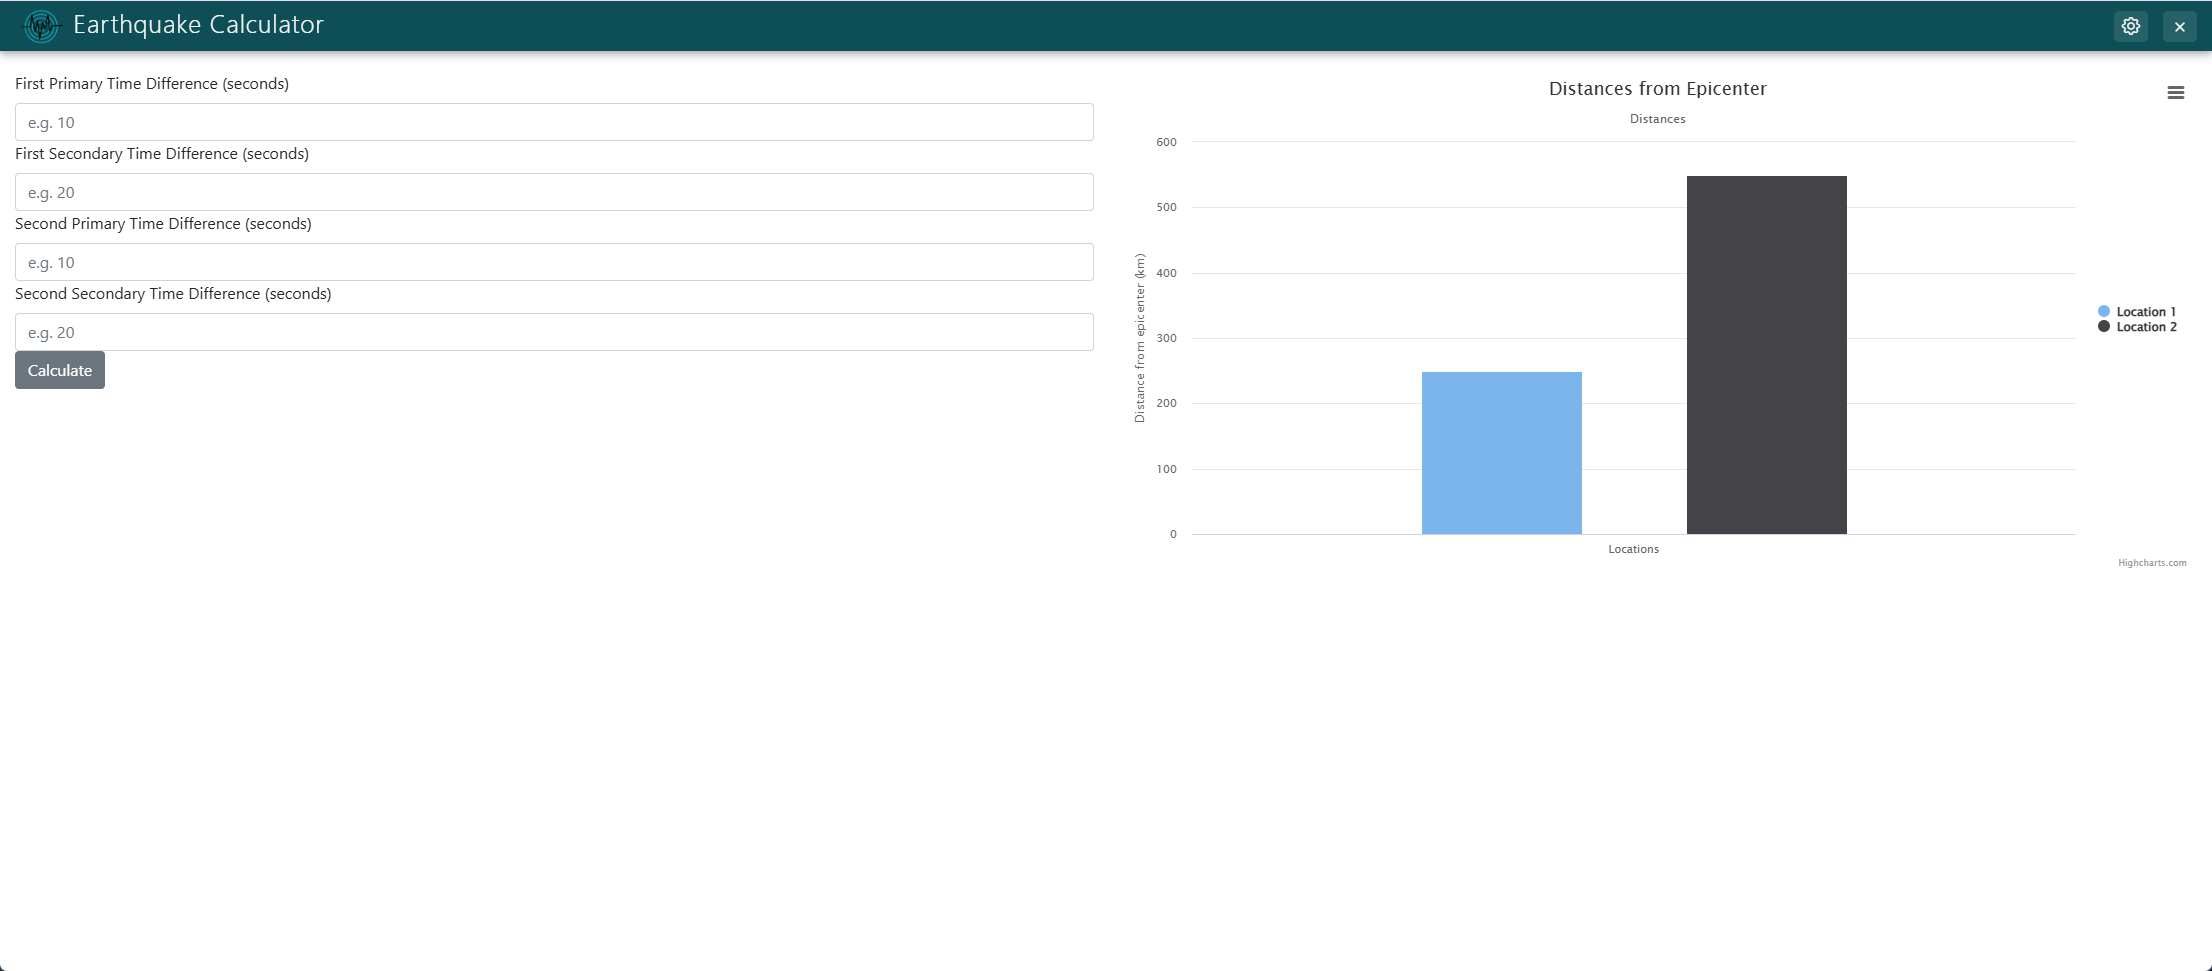
Now that the calculations are working, let's display them in a nicer-looking way. For that, we'll use the BarPlot gizmo.
Begin by once again defining the gizmo in your controller:
from tethys_sdk.gizmos import BarPlot

@controller(name="calculate", url='calculate')
def calculate(request):
    ...
    if request.method == "POST":
        ...

        bar_plot = BarPlot(
            engine='highcharts',
            title='Distances from Epicenter',
            subtitle='Distances',
            vertical=True,
            axis_units='km',
            axis_title='Distance from epicenter',
            categories=['Locations'],
            series=[{
                'name': 'Location 1',
                'data': [distance1]
            }, {
                'name': 'Location 2',
                'data': [distance2]
            }]
        )

        context['bar_plot'] = bar_plot

    return App.render(request, 'calculations.html', context)
Now, let's add this bar plot to your page:
{% block app_content_rc %}
  {% if bar_plot %}
      {% gizmo bar_plot %}
  {% else %}
      <p>Run the calculation to the left to see data here.</p>
  {% endif %}
{% endblock %}
Go ahead and refresh your page, and run your calculations one more time. This time, you should see a beautiful graph pop up with your calculation results.
To learn more about the BarPlot Gizmo, along with other plot Gizmos available with Tethys Platform, see Plot View
Add a MapView Gizmo
Now, let's replace that bar plot with an interactive map. We're going to change a few elements of your application now as well. Begin by removing the second set of inputs and renaming your gizmos and variables to reflect that. Go ahead and remove the calculations being performed and the bar plot gizmo here as well:
from tethys_sdk.gizmos import MapView


@controller(name="calculate", url='calculate')
def calculate(request):
    primary_time_difference = TextInput(name='primary_time_difference', display_text='Primary Time Difference (seconds)', placeholder='e.g. 10', attributes={'type': 'number'})
    secondary_time_difference = TextInput(name='secondary_time_difference', display_text='Secondary Time Difference (seconds)', placeholder='e.g. 20', attributes={'type': 'number'})
    calculate_button = Button(display_text='Calculate', name='calculate_button', icon='calculator', submit=True, attributes={'class': 'btn btn-primary'})

    map_view_options = {
        'height': '400px',
        'width': '100%',
        'controls': 'default',
        'basemap': ['OpenStreetMap'],
    }
    map_view = MapView(**map_view_options)

    context = {
        'primary_time_difference': primary_time_difference,
        'secondary_time_difference': secondary_time_difference,
        'calculate_button': calculate_button,
        'map_view': map_view
    }

    if request.method == "POST":
        primary_velocity = App.get_custom_setting('primary_velocity')
        secondary_velocity = App.get_custom_setting('secondary_velocity')

        primary_time_difference_value = float(request.POST.get('primary_time_difference'))
        secondary_time_difference_value = float(request.POST.get('secondary_time_difference'))

    return App.render(request, 'calculations.html', context)
Next, replace the time difference gizmos inside calculations.html and add the MapView gizmo to your page inside the template by replacing the contents of the 'app_content_rc' block:
{% block app_content_lc %}
    <form method="post" id="calculation-form">
        {% csrf_token %}
        {% gizmo primary_time_difference %}
        {% gizmo secondary_time_difference %}
        {% gizmo calculate_button %}
    </form>
{% endblock %}

{% block app_content_rc %}
    {% gizmo map_view %}
{% endblock %}
Now open your app and refresh the page in your browser and you'll see the following:
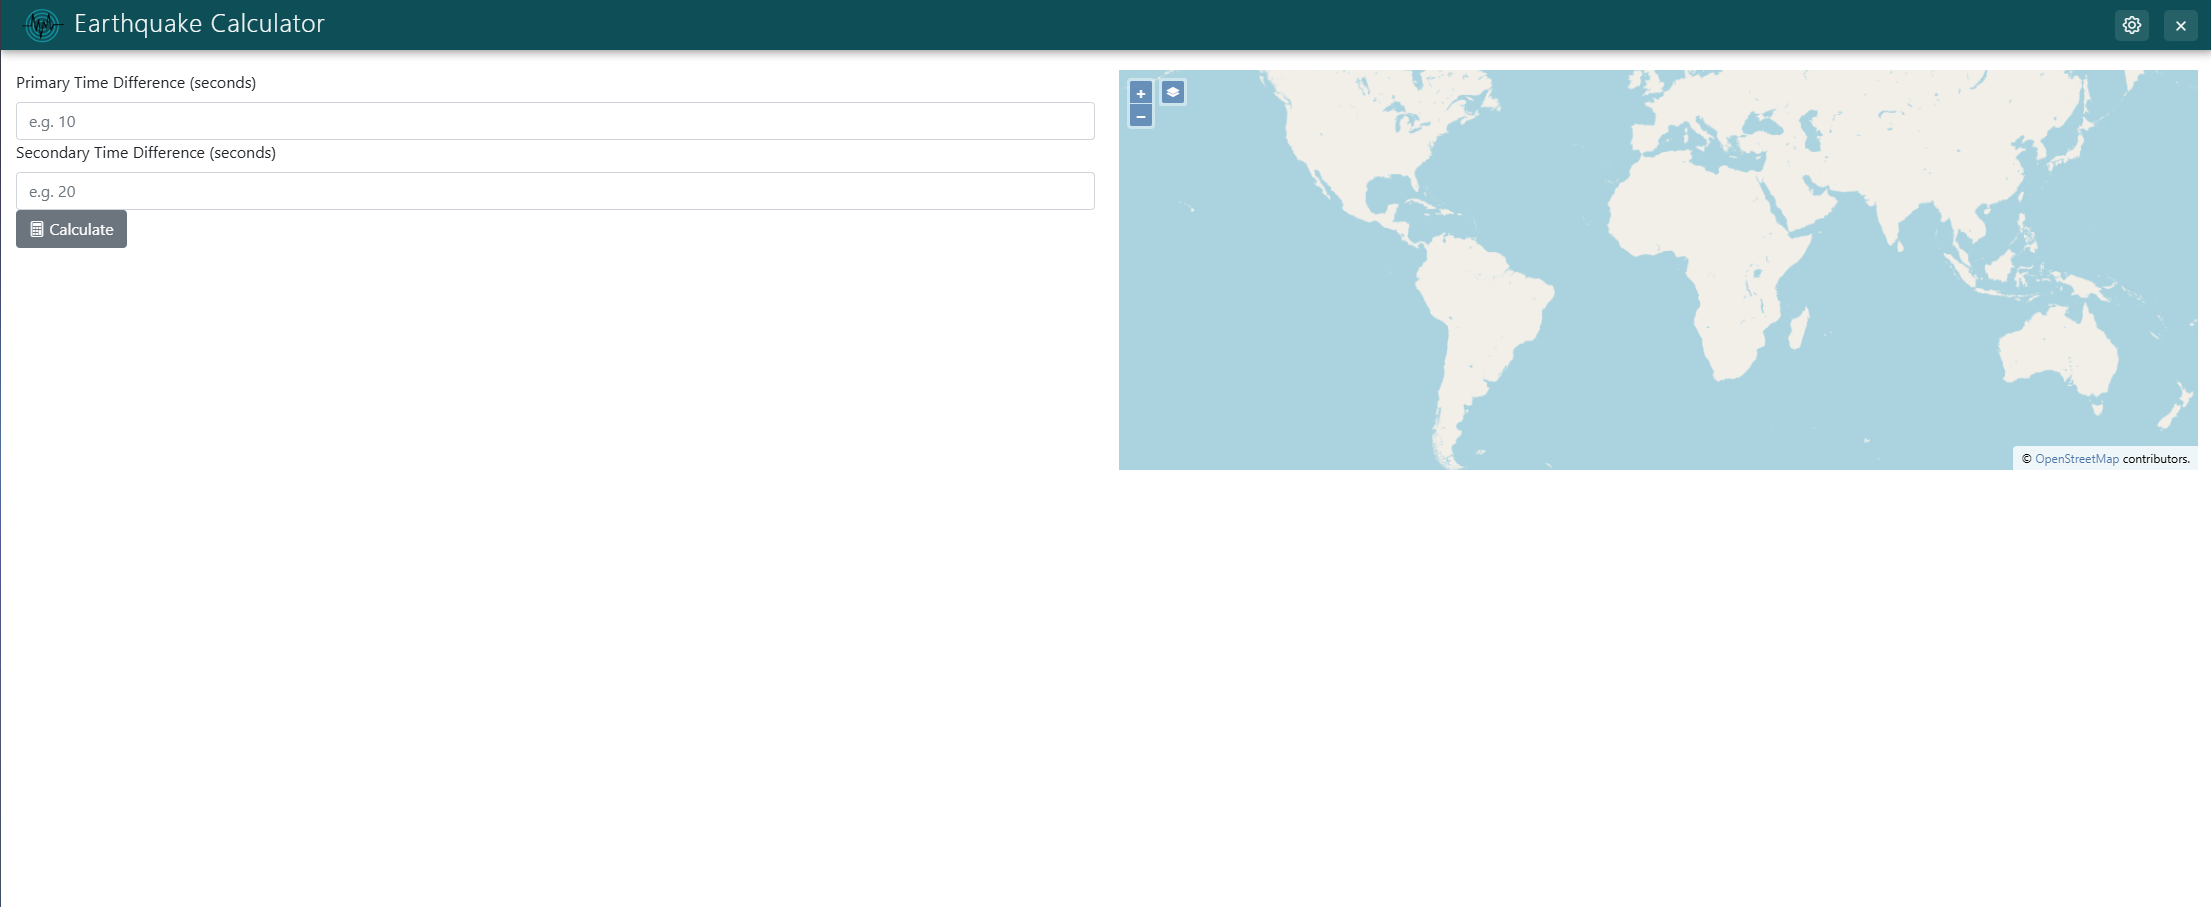
To learn more about the MapView Gizmo, see MapView
Add an ArcGis Layer to the MapView
Now the map is up and running, let's add a layer to it to display locations of fault lines and tectonic plate boundaries:
Begin by building a MapView Layer by adding the following code to controllers.py. The MVLayer object is used to define layers that can be added to a MapView.
from tethys_sdk.gizmos import MVLayer
...

@controller(name="calculate", url='calculate')
def calculate(request):
    ...

    tectonic_faults_layer = MVLayer(
        source='TileArcGISRest',
        options={
            'url': 'https://edumaps.esri.ca/arcgis/rest/services/MapServices/TectonicPlates/MapServer'
        },
        legend_title='Global Tectonic Plates & Faults',
    )
    layers = [tectonic_faults_layer]

    map_view = MapView(layers=layers, **map_view_options)
Open the app and refresh the page to see the tectonic plate boundaries displayed on the map. Zoom in on the map to see fault lines as well.
To learn more about MVLayer, see MVLayer
Get Spatial Input
Now that you've got that MapView gizmo in your calculations page, you're ready to use it to provide spatial input to your app.
In order to do so, we'll begin by adding drawing options that configure how drawing on this map will work. Begin by adding the following code to your controllers.py file. The MVDraw object is used to configure drawing tools for the MapView.
from tethys_sdk.gizmos import MVDraw
...

@controller(name="calculate", url='calculate')
def calculate(request):
    ...
    drawing_options = MVDraw(
        controls=['Point'],
        initial='Point',
        output_format='GeoJSON',
        line_color='#663399',
        fill_color='rgba(255,255,255,0.2)',
        point_color='#663399'
    )

    map_view_options = {
        'height': '400px',
        'width': '100%',
        'controls': 'default',
        'basemap': ['OpenStreetMap'],
        'draw': drawing_options,
    }
Now test it! Open your app and refresh the page. You should now be able to draw points on the map by clicking. Those points on the map should show up as purple dots just like you configured in drawing_options.
To learn more about MVDraw, see MVDraw
Next, we'll need to include the MapView gizmo's geometry data in your form. For this, we're going to add an attribute to your MapView gizmo's options:
    map_view_options = {
        'height': '400px',
        'width': '100%',
        'controls': 'default',
        'basemap': ['OpenStreetMap'],
        'draw': drawing_options,
        'form_id': 'calculation-form'
    }
This attribute simply makes it so that whenever the calculation-form is submitted, this MapView's geometry data is added to the form's data being sent in the request.
Now whenever you press the 'calculate' button, the request will include some data from the point you place on the map. Here's how you can access that data:
import json
...

@controller(name="calculate", url='calculate')
def calculate(request):
    ...
    if request.method == "POST":
        primary_velocity = App.get_custom_setting('primary_velocity')
        secondary_velocity = App.get_custom_setting('secondary_velocity')

        primary_time_difference_value = float(request.POST.get('primary_time_difference'))
        secondary_time_difference_value = float(request.POST.get('secondary_time_difference'))

        point_geojson = json.loads(request.POST.get("geometry"))
        coordinates = point_geojson.get("geometries")[0].get("coordinates")
        print("Coordinates selected: ", coordinates)
Now whenever you press calculate, the coordinates of the point you've drawn will be printed out to the terminal.
Add a GeoJSON layer to the MapView
Now that we have access to the coordinates of points drawn on the map and the distance to the epicenter, let's visualize some data on the map.
We'll start by generating data that can be visualized on the map in the form of a circle around the point drawn on the map to illustrate places where the epicenter could be:
Inside utils.py, add the following code:
import math
...

def generate_circle_coordinates(center_lat, center_lon, radius):
    earth_radius = 6371
    circumference = 2 * math.pi * radius
    num_points = int(circumference / 50)
    num_points = max(36, min(360, num_points))

    points = []
    angular_radius = radius / earth_radius

    for i in range(num_points):
        angle = 2 * math.pi * i / num_points
        lat = math.asin(math.sin(math.radians(center_lat)) * math.cos(angular_radius) +
                        math.cos(math.radians(center_lat)) * math.sin(angular_radius) * math.cos(angle))
        lon = math.radians(center_lon) + math.atan2(math.sin(angle) * math.sin(angular_radius) * math.cos(math.radians(center_lat)),
                                                     math.cos(angular_radius) - math.sin(math.radians(center_lat)) * math.sin(lat))

        lon_deg = math.degrees(lon)
        lon_deg = ((lon_deg + 180) % 360) - 180  # normalize to [-180, 180]

        points.append((lon_deg, math.degrees(lat)))

    points.append(points[0])

    return points
Next, let's use our new coordinates generation function:
from .utils import generate_circle_coordinates
...

@controller(name="calculate", url='calculate')
def calculate(request):
    ...
    if request.method == "POST":
        primary_velocity = App.get_custom_setting('primary_velocity')
        secondary_velocity = App.get_custom_setting('secondary_velocity')

        primary_time_difference_value = float(request.POST.get('primary_time_difference'))
        secondary_time_difference_value = float(request.POST.get('secondary_time_difference'))

        distance = calculate_distance(
            primary_time_difference_value,
            secondary_time_difference_value,
            primary_velocity,
            secondary_velocity
        )

        point_geojson = json.loads(request.POST.get("geometry"))
        coordinates = point_geojson.get("geometries")[0].get("coordinates")
        center_lon, center_lat = coordinates

        circle_coordinates = generate_circle_coordinates(center_lat, center_lon, distance)
For this visualization, we're not only going to create a circle, we're going to put the center point on the map as well. Go ahead and add this code as well to controllers.py:
    if request.method == "POST":
        primary_velocity = App.get_custom_setting('primary_velocity')
        secondary_velocity = App.get_custom_setting('secondary_velocity')

        primary_time_difference_value = float(request.POST.get('primary_time_difference'))
        secondary_time_difference_value = float(request.POST.get('secondary_time_difference'))

        distance = calculate_distance(
            primary_time_difference_value,
            secondary_time_difference_value,
            primary_velocity,
            secondary_velocity
        )

        point_geojson = json.loads(request.POST.get("geometry"))
        coordinates = point_geojson.get("geometries")[0].get("coordinates")
        center_lon, center_lat = coordinates

        circle_coordinates = generate_circle_coordinates(center_lat, center_lon, distance)

        circle_geojson = {
            "type": "FeatureCollection",
            "features": [
                {
                    "type": "Feature",
                    "geometry": {
                        "type": "LineString",
                        "coordinates": circle_coordinates
                    },
                },
                {
                    "type": "Feature",
                    "geometry": {
                        "type": "Point",
                        "coordinates": [center_lon, center_lat]
                    },
                    "properties": {
                        "distance": distance,
                        "primary_time_difference": primary_time_difference_value,
                        "secondary_time_difference": secondary_time_difference_value,
                        "primary_velocity": primary_velocity,
                        "secondary_velocity": secondary_velocity
                    }
                }
            ]
        }
Now add some style information to apply to this visual data:
    circle_geojson = {
        "type": "FeatureCollection",
        "features": [
            {
                "type": "Feature",
                "geometry": {
                    "type": "LineString",
                    "coordinates": circle_coordinates
                },
            },
            {
                "type": "Feature",
                "geometry": {
                    "type": "Point",
                    "coordinates": [center_lon, center_lat]
                },
                "properties": {
                    "distance": distance,
                    "primary_time_difference": primary_time_difference_value,
                    "secondary_time_difference": secondary_time_difference_value,
                    "primary_velocity": primary_velocity,
                    "secondary_velocity": secondary_velocity
                }
            }
        ]
    }

    style_map = {
        "Point": {
            "ol.style.Style": {
                "image": {
                    "ol.style.Circle": {
                        "radius": 6,
                        "fill": {
                            "ol.style.Fill": {
                                "color": "#663399"
                            }
                        },
                        "stroke": {
                            "ol.style.Stroke": {
                                "color": "#fff",
                                "width": 2
                            }
                        }
                    }
                }
            }
        },
        "LineString": {
            "ol.style.Style": {
                "stroke": {
                    "ol.style.Stroke": {
                        "color": "#1D5706",
                        "width": 2
                    }
                }
            }
        }
    }
Next, create the Layer to put on the map with that geojson data:
    ...
        "LineString": {
            "ol.style.Style": {
                "stroke": {
                    "ol.style.Stroke": {
                        "color": "#1D5706",
                        "width": 2
                    }
                }
            }
        }
    }

    circle_layer = MVLayer(
        source='GeoJSON',
        options=circle_geojson,
        layer_options={
            "style_map": style_map
        },

        legend_title='Earthquake Distance',
    )
    layers.append(circle_layer)
Before you can test this, you'll need to move the MapView gizmo down in your code, just above the page render:
@controller(name="calculate", url='calculate')
def calculate(request):
    ...
    layers = [tectonic_faults_layer]
    map_view = MapView(layers=layers, **map_view_options) # remove this line

    context = {
        'primary_time_difference': primary_time_difference,
        'secondary_time_difference': secondary_time_difference,
        'calculate_button': calculate_button,
        'map_view': map_view # remove this line
    }
    ...
    if request.method == "POST":
        ...
        circle_layer = MVLayer(
            source='GeoJSON',
            options=circle_geojson,
            layer_options={
                "style_map": style_map
            },

            legend_title='Earthquake Distance',
        )
        layers.append(circle_layer)

    map_view = MapView(layers=layers, **map_view_options)
    context['map_view'] = map_view

    return App.render(request, 'calculations.html', context)
Now go ahead and open your app and input some values to your form and place a point on the map and hit "Calculate" to see the results on your map!
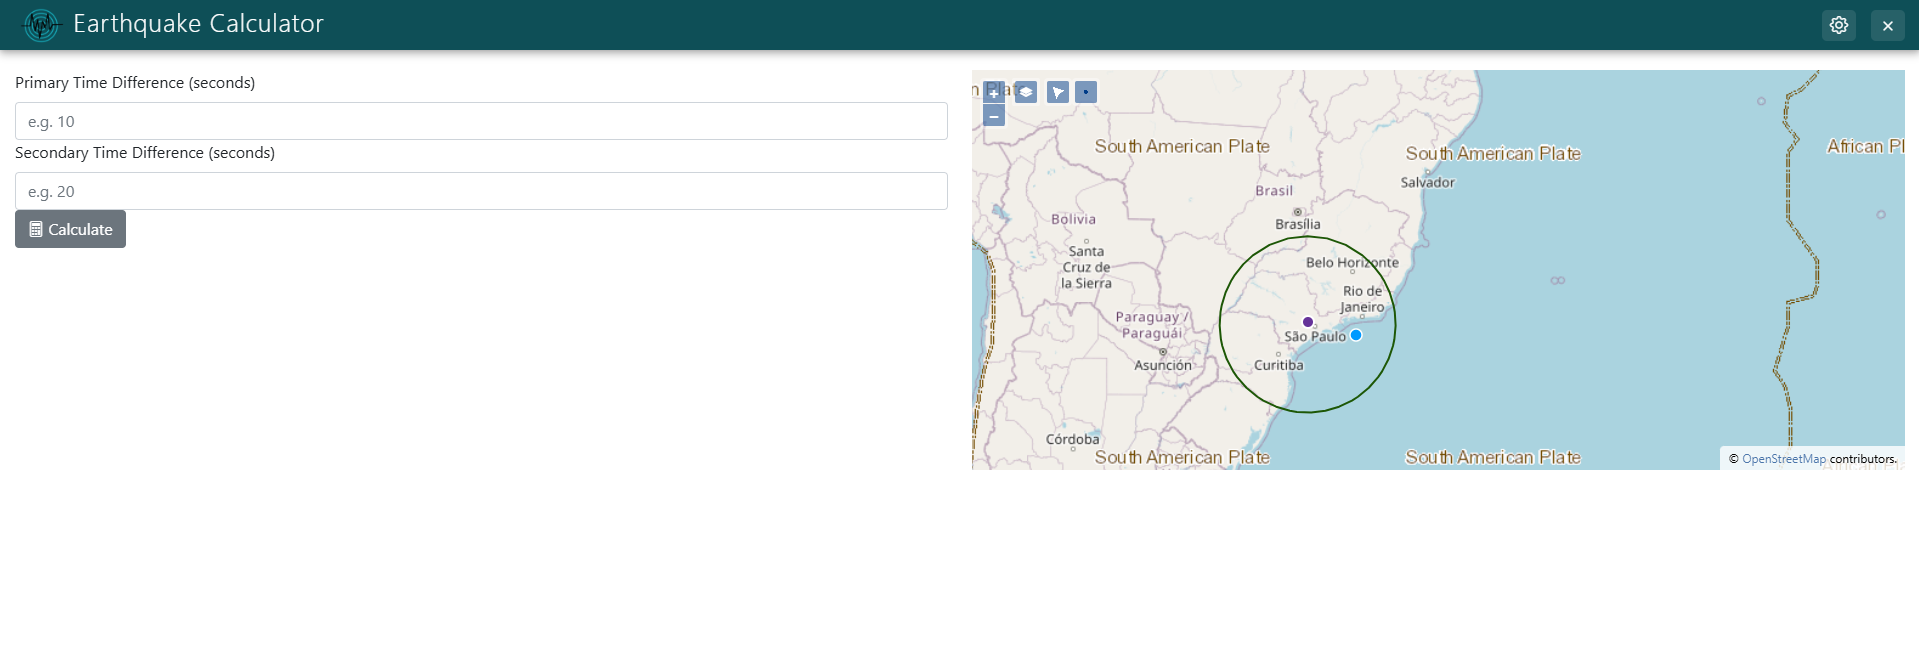
Save Calculation Results
The next step to building out this app will be adding a new map with a large map using the MapLayout. We'll also be adding functionality to your form to save the results to a file to keep a record of them. You'll then display those results on the map. We'll begin by adding that results record-keeping first.
We'll be using the Tethys Paths API to provide a directory to save these results to. For this example, we'll use the app_workspace directory
Start by adding app_workspace=True to your controller decorator and the app_workspace argument to your controller like so:
@controller(name="calculate", url='calculate', app_workspace=True)
def calculate(request, app_workspace):
    ...
Now, after you've built your circle geojson object, we'll save that data to a .json file
import os

@controller(name="calculate", url='calculate', app_workspace=True)
def calculate(request, app_workspace):
    ...
    if request.method == "POST":
        ...
        circle_geojson = {
            "type": "FeatureCollection",
            "features": [
                {
                    "type": "Feature",
                    "geometry": {
                        "type": "LineString",
                        "coordinates": circle_coordinates
                    },
                },
                {
                    "type": "Feature",
                    "geometry": {
                        "type": "Point",
                        "coordinates": [center_lon, center_lat]
                    },
                    "properties": {
                        "distance": distance,
                        "primary_time_difference": primary_time_difference_value,
                        "secondary_time_difference": secondary_time_difference_value,
                        "primary_velocity": primary_velocity,
                        "secondary_velocity": secondary_velocity
                    }
                }
            ]
        }

        json_path = f"{app_workspace.path}/measurements.json"
        if not os.path.exists(json_path):
            with open(json_path, "w") as measurements_file:
                json.dump({"type": "FeatureCollection", "features": []}, measurements_file, indent=2)

        with open(json_path, "r+") as measurements_file:
            measurements_json = json.load(measurements_file)
            measurements_json.get("features").extend(circle_geojson.get("features"))
            measurements_file.seek(0)
            json.dump(measurements_json, measurements_file, indent=2)
            measurements_file.truncate()
Now each time you press "calculate", the results will be saved to your measurements.json file inside your app_workspace directory.
To learn more about the Tethys Paths API and the app_workspace directory, see Paths API.
Add a MapLayout Page
The last step now will be to add your MapLayout page and add a layer with your saved measurements data.
The MapLayout is a pre-built Tethys layout that provides a full-page map view with built-in features like layer groups, legends, and properties popups.
Begin by adding the following code to your controllers.py file:
from tethys_sdk.layouts import MapLayout
...

@controller(name="view_all_earthquakes", url="view-all-earthquakes", app_workspace=True)
class CalculationResultMapLayout(MapLayout):
    app = App
    base_template = 'earthquake_calculator/base.html'
    map_title = 'Earthquake Calculator Map'
    map_subtitle = 'All reported earthquakes'
    basemaps = [
        'OpenStreetMap',
        'ESRI'
    ]
Now we'll add a button to navigate to your new page. Add the following code to your calculations page controller:
@controller(name="calculate", url='calculate', app_workspace=True)
def calculate(request, app_workspace):
    primary_time_difference = TextInput(name='primary_time_difference', display_text='Primary Time Difference (seconds)', placeholder='e.g. 10', attributes={'type': 'number'})
    secondary_time_difference = TextInput(name='secondary_time_difference', display_text='Secondary Time Difference (seconds)', placeholder='e.g. 20', attributes={'type': 'number'})
    calculate_button = Button(display_text='Calculate', name='calculate_button', icon='calculator', submit=True, attributes={'class': 'btn btn-primary'})
    view_all_earthquakes_button = Button(display_text='View all', name='view_all_earthquakes_button', icon='map', href=App.reverse('view_all_earthquakes'), attributes={'class': 'btn btn-secondary'})
    ...
    context = {
        'primary_time_difference': primary_time_difference,
        'secondary_time_difference': secondary_time_difference,
        'calculate_button': calculate_button,
        'view_all_earthquakes_button': view_all_earthquakes_button
    }
Next, place that gizmo in your calculations template:
{% block app_content_rc%}
    <div class="container">
        {% gizmo map_view %}
        {% gizmo view_all_earthquakes_button %}
    </div>
{% endblock %}
Now open your calculations page and click on the new button! This should take you to a new page with a full-sized map:
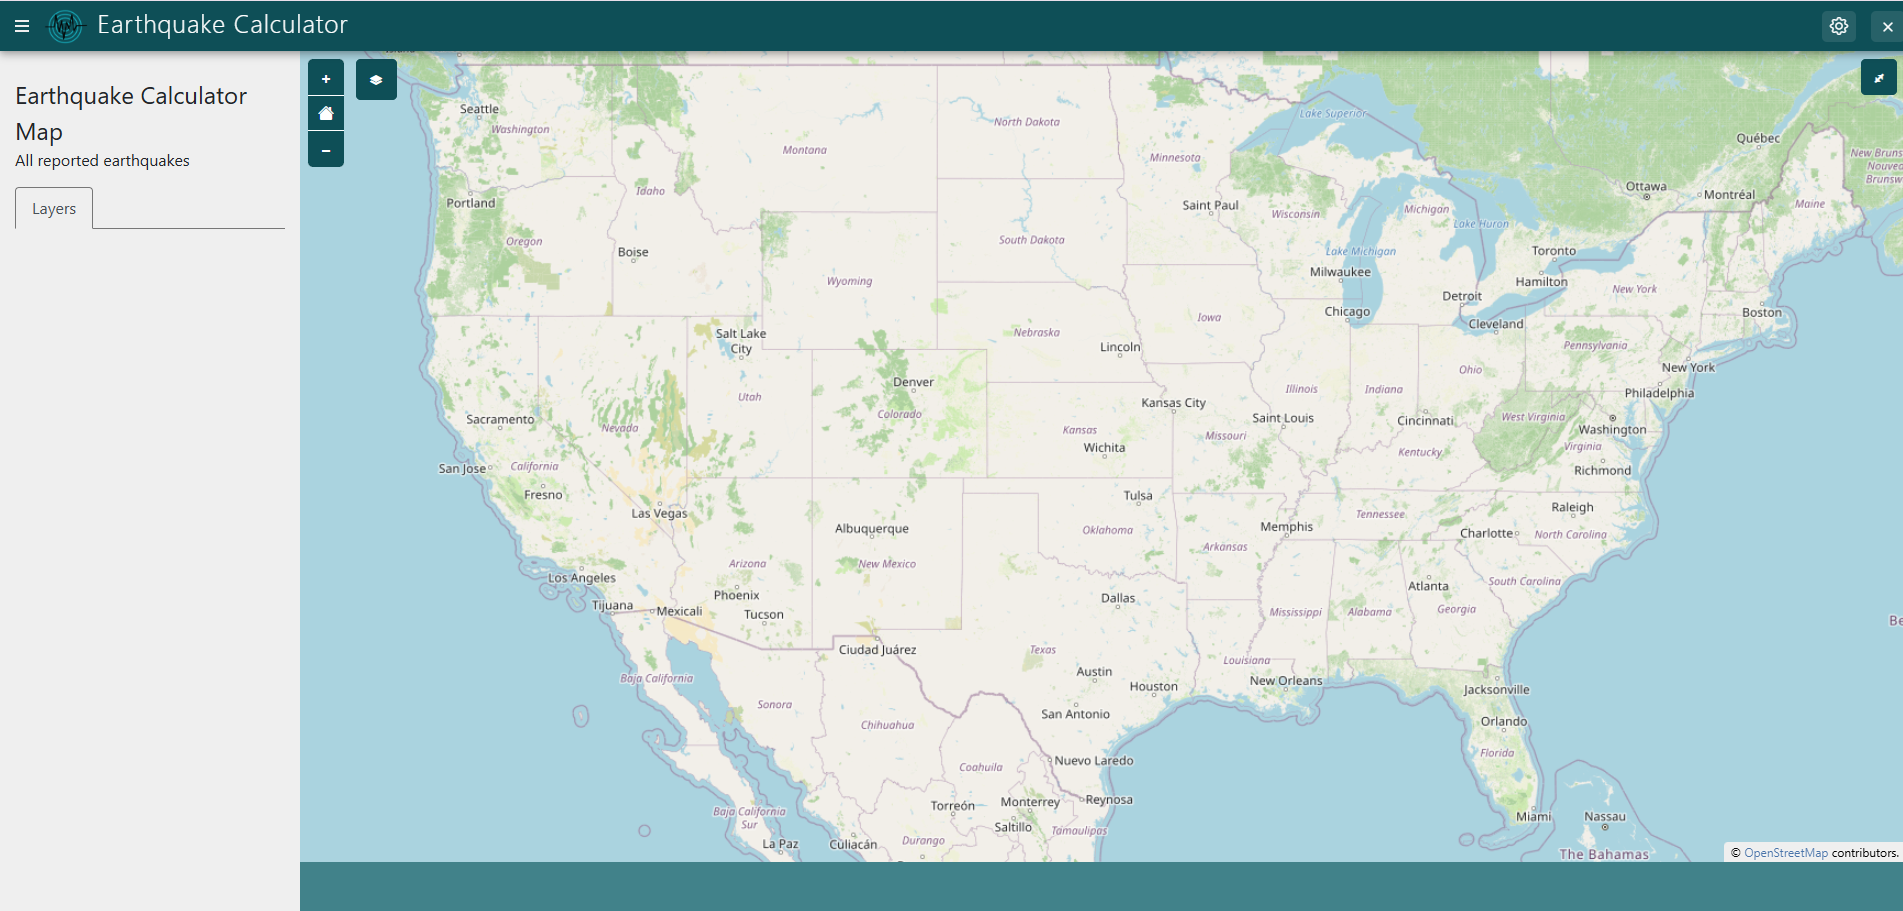
To learn more about Map Layout, see Map Layout
Display Stored Results in MapLayout
Finally, you'll need to create a layer on your MapLayout map with the stored measurements.
Begin by adding the compose_layers method to your MapLayout controller class in controllers.py:
@controller(name="view_all_earthquakes", url="view-all-earthquakes", app_workspace=True)
class CalculationResultMapLayout(MapLayout):
    ...

    def compose_layers(self, request, map_view, app_workspace, *args, **kwargs):
        measurements_path = f"{app_workspace.path}/measurements.json"
        if not os.path.exists(measurements_path):
            return []

        with open(measurements_path, "r") as measurements_file:
            measurements_geojson = json.load(measurements_file)

        geojson_layer = self.build_geojson_layer(
            geojson=measurements_geojson,
            layer_name='earthquake_measurements',
            layer_title='Earthquake Measurements',
            layer_variable='earthquake_measurements',
            selectable=True,
            plottable=True,
        )

        layer_groups = [
            self.build_layer_group(
                id='earthquake-measurements-layers',
                display_name='Earthquake Measurements',
                layers=[geojson_layer]
            )
        ]

        return layer_groups
Now, make sure you've added some measurements to your stored measurements.json file, then navigate to the "View all earthquakes" page. On the map you should see all of your stored earthquake records
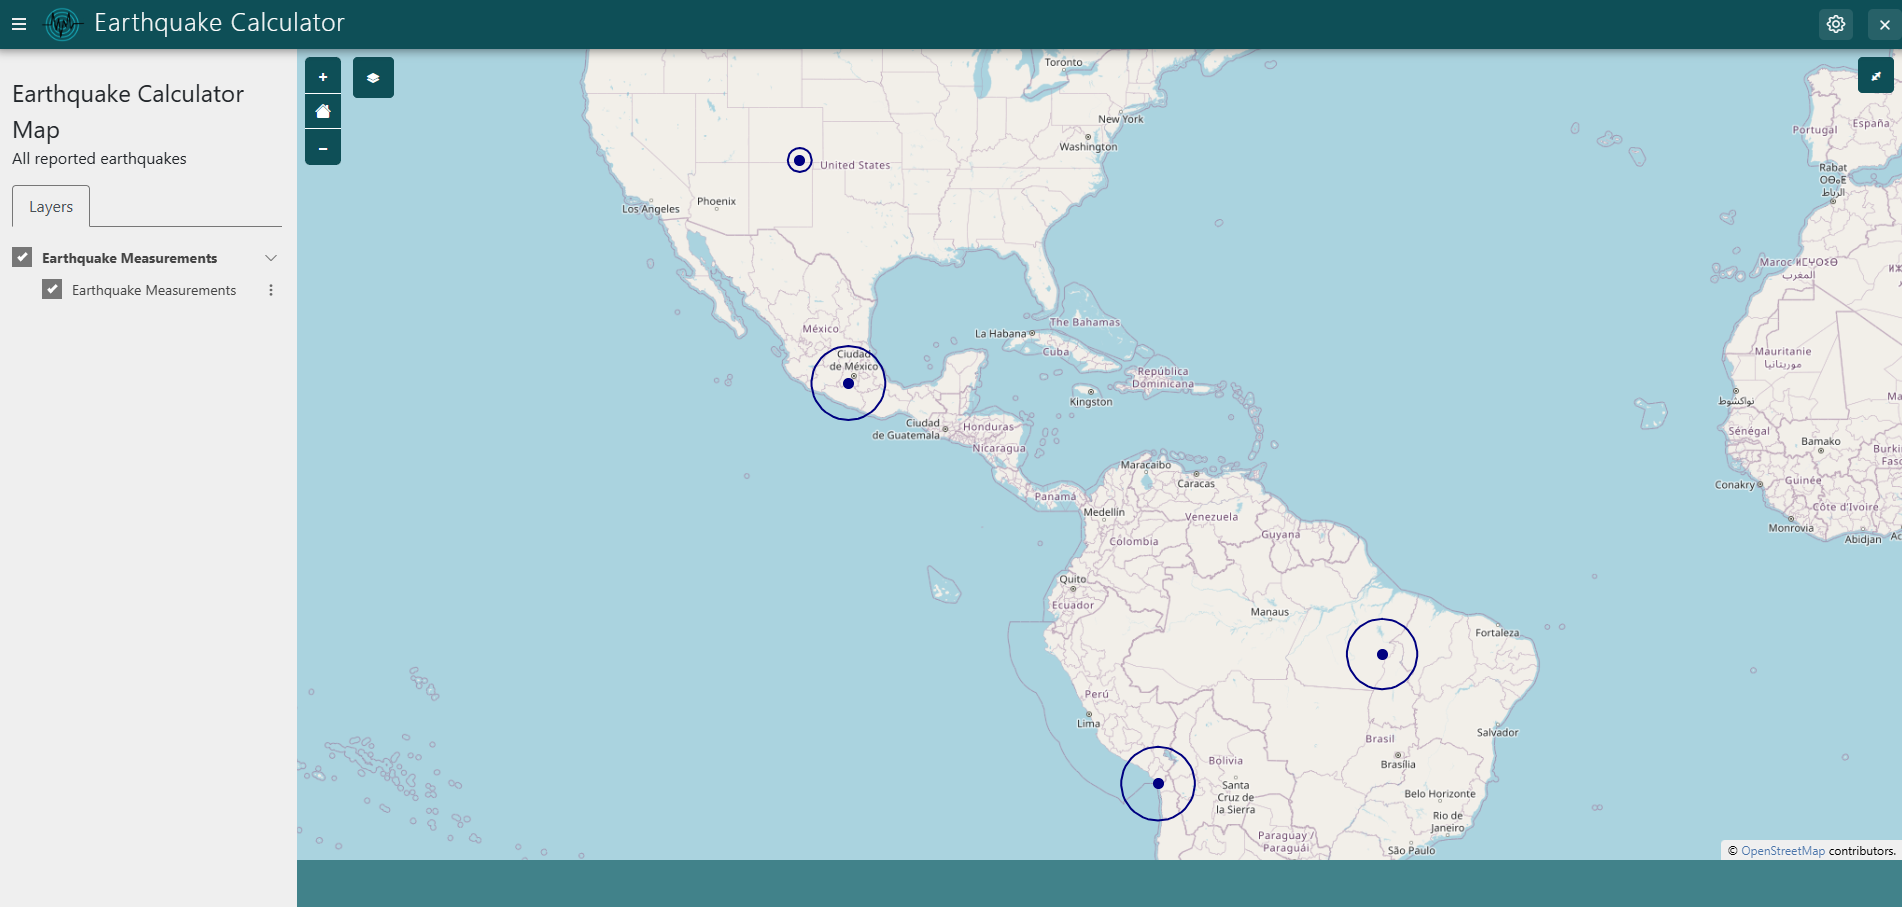
Add a Plot
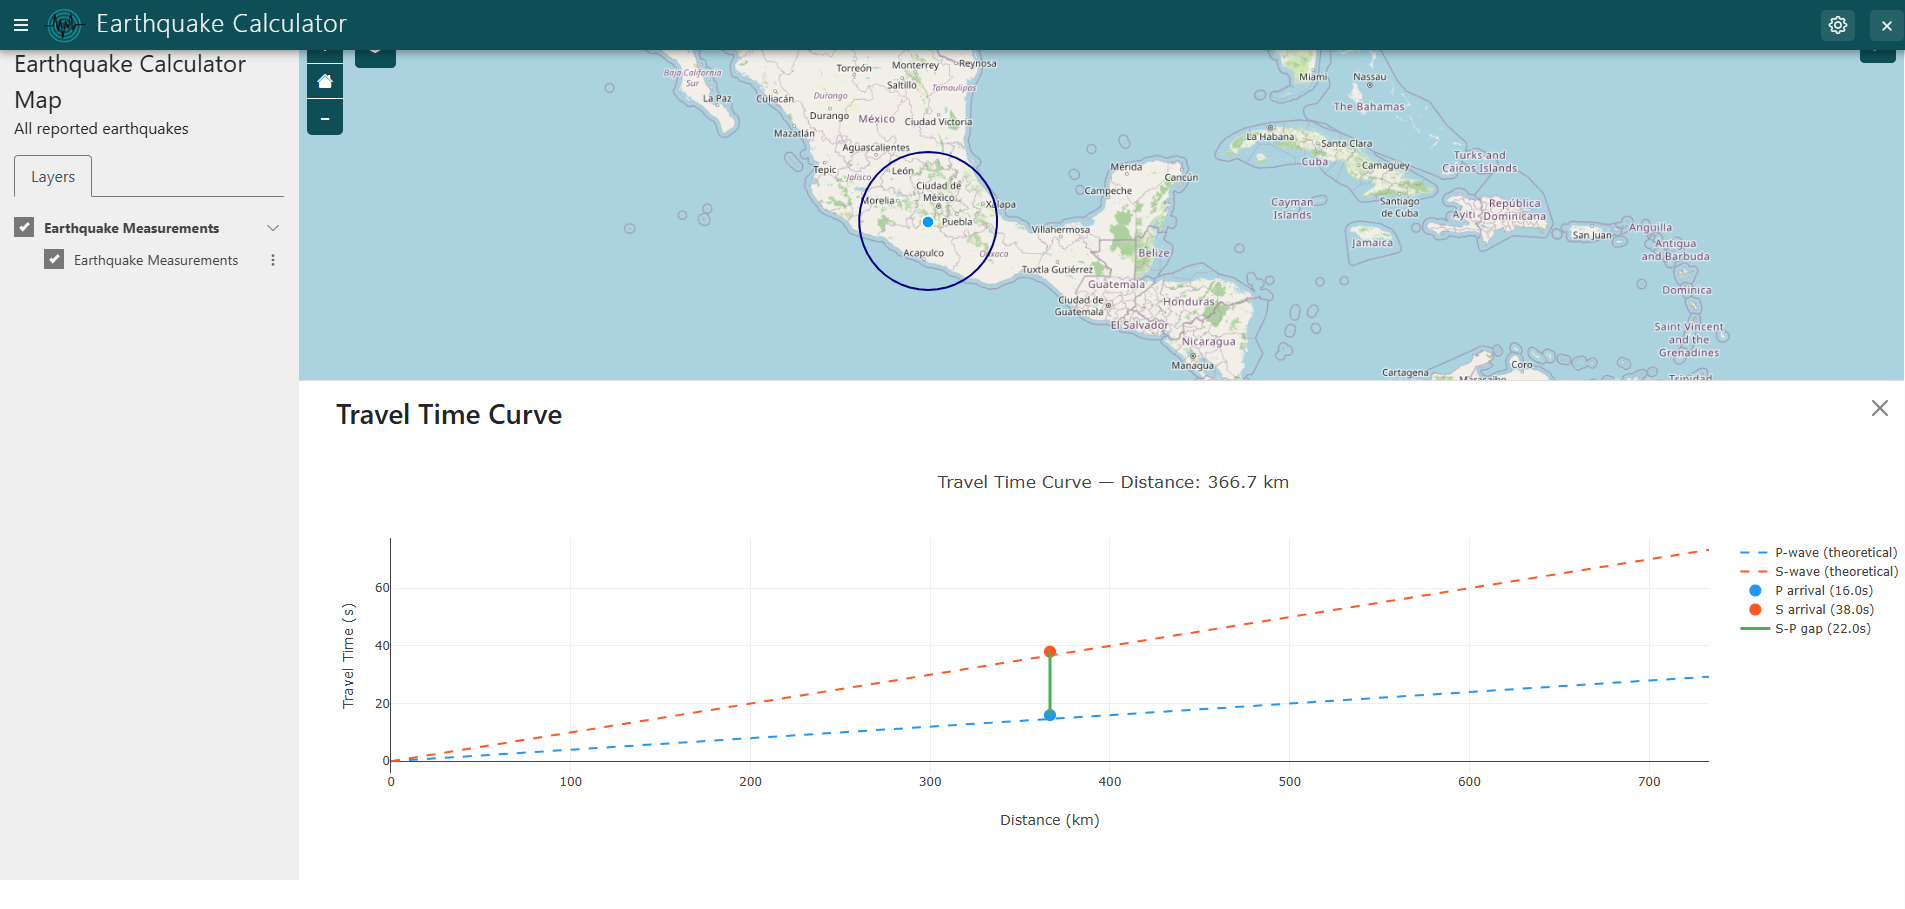
The final set of additions we'll be making will use the plot_slide_sheet tool built into MapLayout
These additions will allow you to click on the center points of the circles displayed on the map and display properties in a popup, along with a button that will cause the plot_slide_sheet to appear with a graph using those properties.
Begin by updating your MapLayout class:
@controller(name="view_all_earthquakes", url="view-all-earthquakes", app_workspace=True)
class CalculationResultMapLayout(MapLayout):
    app = App
    base_template = 'earthquake_calculator/base.html'
    map_title = 'Earthquake Calculator Map'
    map_subtitle = 'All reported earthquakes'
    basemaps = [
        'OpenStreetMap',
        'ESRI'
    ]
    show_properties_popup = True
    plot_slide_sheet = True
Next, in order to calculate the graph data needed, add the following code to your MapLayout class in controllers.py:
import numpy as np

@controller(name="view_all_earthquakes", url="view-all-earthquakes", app_workspace=True)
class CalculationResultMapLayout(MapLayout):
    ...

    def get_plot_for_layer_feature(self, request, layer_name, feature_id, layer_data, feature_props, *args, **kwargs):
        # LineString features (circles) have no wave props — skip them
        p_time = feature_props.get('primary_time_difference')
        s_time = feature_props.get('secondary_time_difference')
        if p_time is None or s_time is None:
            return 'No data', [], {}

        p_time = float(p_time)
        s_time = float(s_time)
        p_velocity = float(feature_props.get('primary_velocity'))
        s_velocity = float(feature_props.get('secondary_velocity'))
        distance = float(feature_props.get('distance'))
        sp_gap = s_time - p_time

        # Average travel time lines
        max_dist = max(distance * 2, 100)
        dist_range = np.linspace(0, max_dist, 200).tolist()
        p_line = (np.array(dist_range) / p_velocity).tolist()
        s_line = (np.array(dist_range) / s_velocity).tolist()

        data = [
            # Average P-wave line
            {
                'x': dist_range,
                'y': p_line,
                'mode': 'lines',
                'name': 'P-wave (average)',
                'line': {'color': '#2196F3', 'width': 2, 'dash': 'dash'},
            },
            # Average S-wave line
            {
                'x': dist_range,
                'y': s_line,
                'mode': 'lines',
                'name': 'S-wave (average)',
                'line': {'color': '#FF5722', 'width': 2, 'dash': 'dash'},
            },
            # Incident P arrival point
            {
                'x': [distance],
                'y': [p_time],
                'mode': 'markers',
                'name': f'P arrival ({p_time}s)',
                'marker': {'color': '#2196F3', 'size': 12},
            },
            # Incident S arrival point
            {
                'x': [distance],
                'y': [s_time],
                'mode': 'markers',
                'name': f'S arrival ({s_time}s)',
                'marker': {'color': '#FF5722', 'size': 12},
            },
            # Vertical line showing S-P gap (drawn as a scatter segment)
            {
                'x': [distance, distance],
                'y': [p_time, s_time],
                'mode': 'lines',
                'name': f'S-P gap ({sp_gap:.1f}s)',
                'line': {'color': '#4CAF50', 'width': 3},
                'showlegend': True,
            },
        ]

        layout = {
            'title': f'Travel Time Curve — Distance: {distance:.1f} km',
            'xaxis': {
                'title': 'Distance (km)',
                'gridcolor': '#eee',
            },
            'yaxis': {
                'title': 'Travel Time (s)',
                'gridcolor': '#eee',
            },
        }

        return 'Travel Time Curve', data, layout
Now go ahead and refresh your app, and click on any center point inside the earthquake circles on the map, and click "Plot" in the popup that appears. You should see something like this:
Wrapping Up
That's it! You've built a complete Tethys app. You've learned how to do the following:
- Scaffold a new Tethys app
- Customize its look
- Wire up forms and custom settings
- Perform calculations
- Visualize the results with both interactive maps and plots.
Solution
The completed solution for this workshop is available on GitHub: tethysapp-earthquake_calculator
Next Steps
Now that you've completed this tutorial, here are some recommended resources to continue your Tethys Platform journey:
- Key Concepts Tutorials – Learn beginner, intermediate, and advanced concepts for building Tethys apps.
- Map Layout Tutorial – Dive deeper into the MapLayout and its full set of features.
- Gizmos Reference – Explore all available Tethys gizmos (inputs, plots, maps, etc.).
- Templating Reference – Learn more about the Tethys templating system and available base templates.
- App Settings – Learn about all the types of app settings available in Tethys.
- Tethys Paths API – Manage file storage for your app using workspace and media directories.
- Tethys Platform Documentation – The full Tethys Platform documentation with all tutorials, recipes, and SDK references.